Deploy Chartbrew
Build live charts and dashboards from your APIs and databases
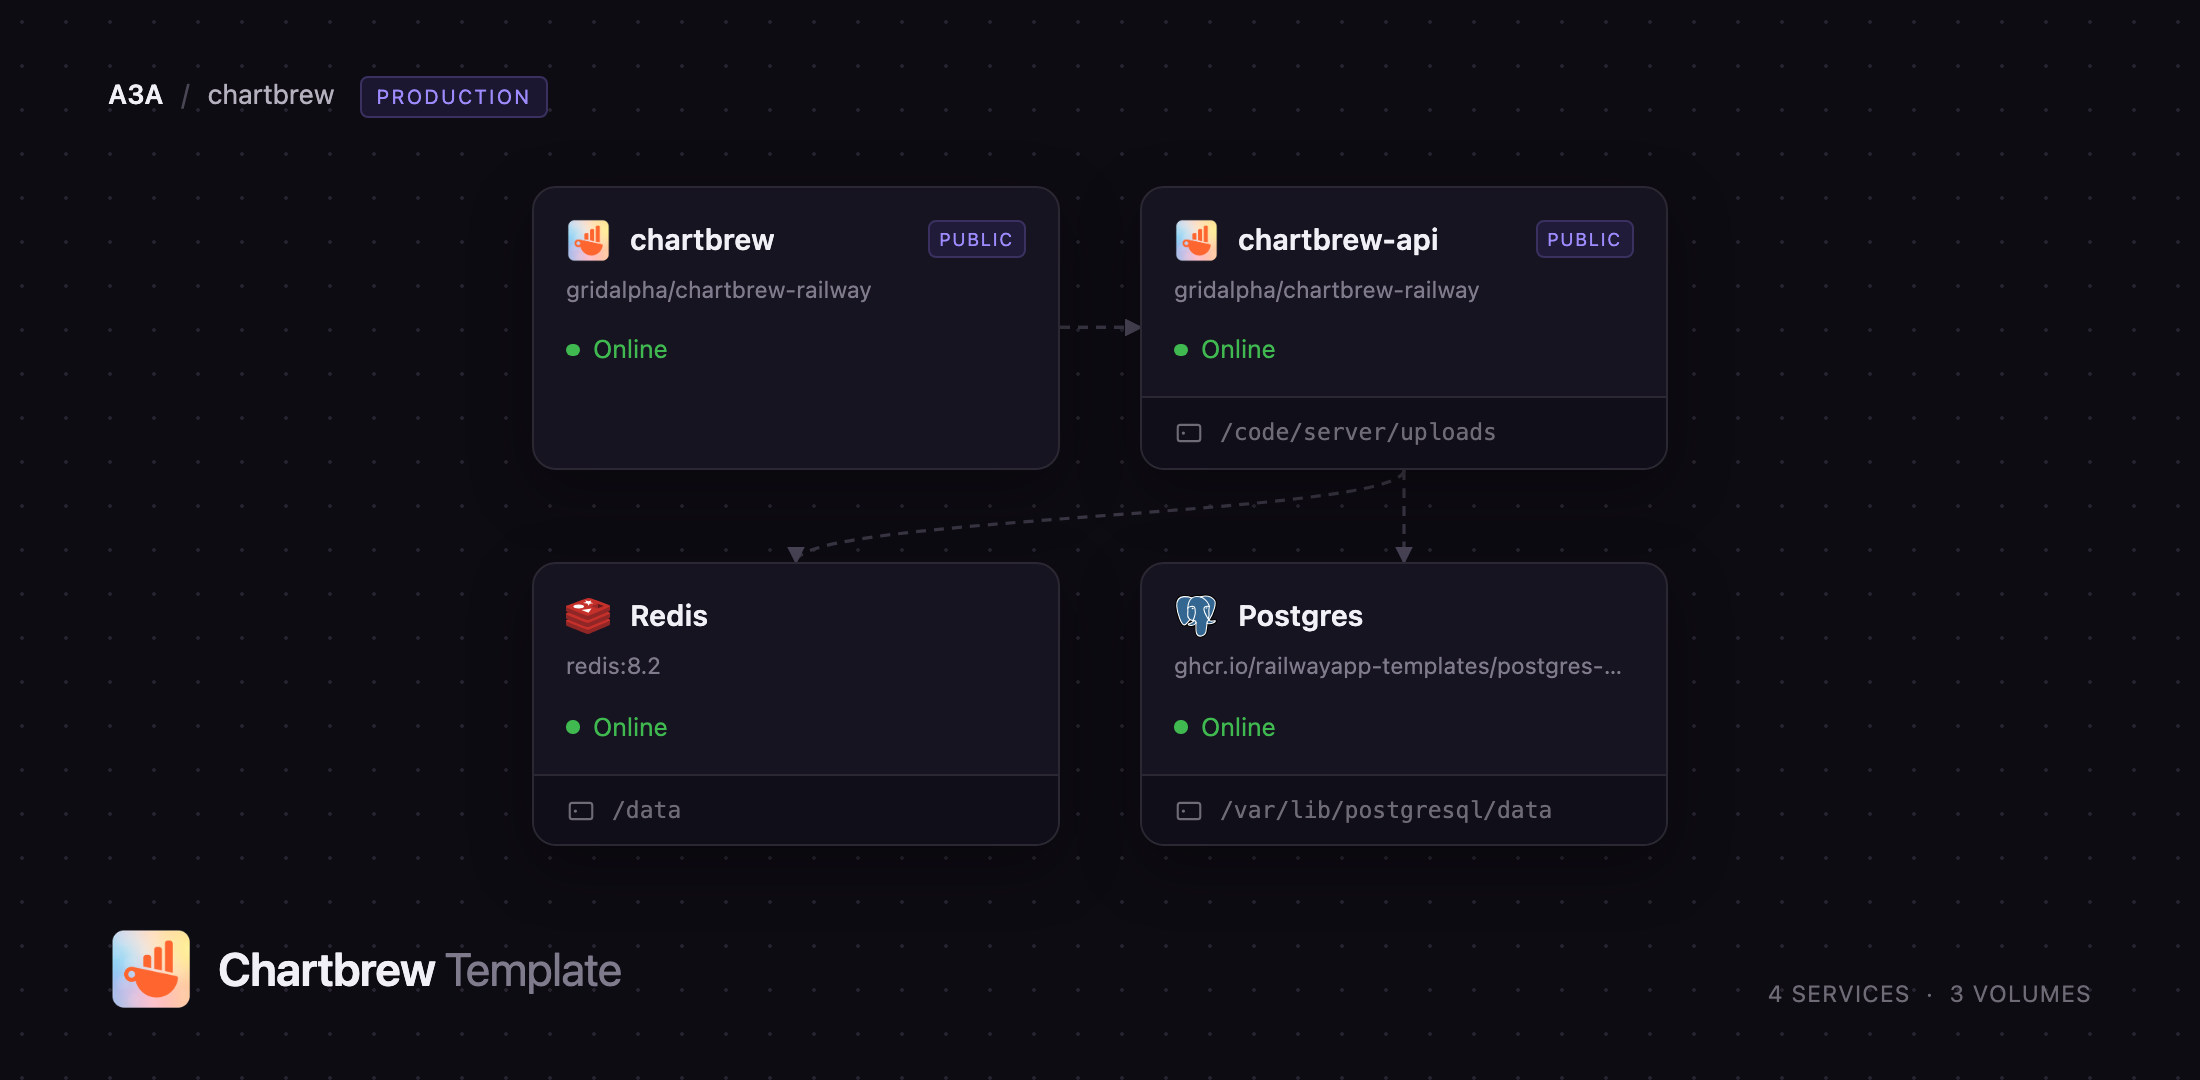
Redis
Just deployed
/data

Just deployed
/var/lib/postgresql/data
chartbrew-api
Just deployed
/code/server/uploads
chartbrew
Just deployed
Deploy and Host Chartbrew on Railway
Chartbrew is an open-source reporting platform that turns APIs, SQL databases and NoSQL collections into live dashboards you can share with a link or embed in your own product. You point it at a data source, describe the query once as a reusable dataset, then build as many charts on it as you need — line, bar, pie, table, KPI — without writing frontend code.
Deploy Chartbrew on Railway and you get the full production shape rather than a single container. The template runs four services: a Chartbrew UI service serving the React app, a Chartbrew API service running the REST API, the Socket.IO realtime channel, the BullMQ queues and the chart-refresh schedulers, a PostgreSQL database holding dashboards, datasets and encrypted connection credentials, and Redis backing the queues and cache. Only the API reaches Postgres and Redis, over the private network, and a volume on it stores logos and chart snapshots.
Getting Started with Chartbrew on Railway
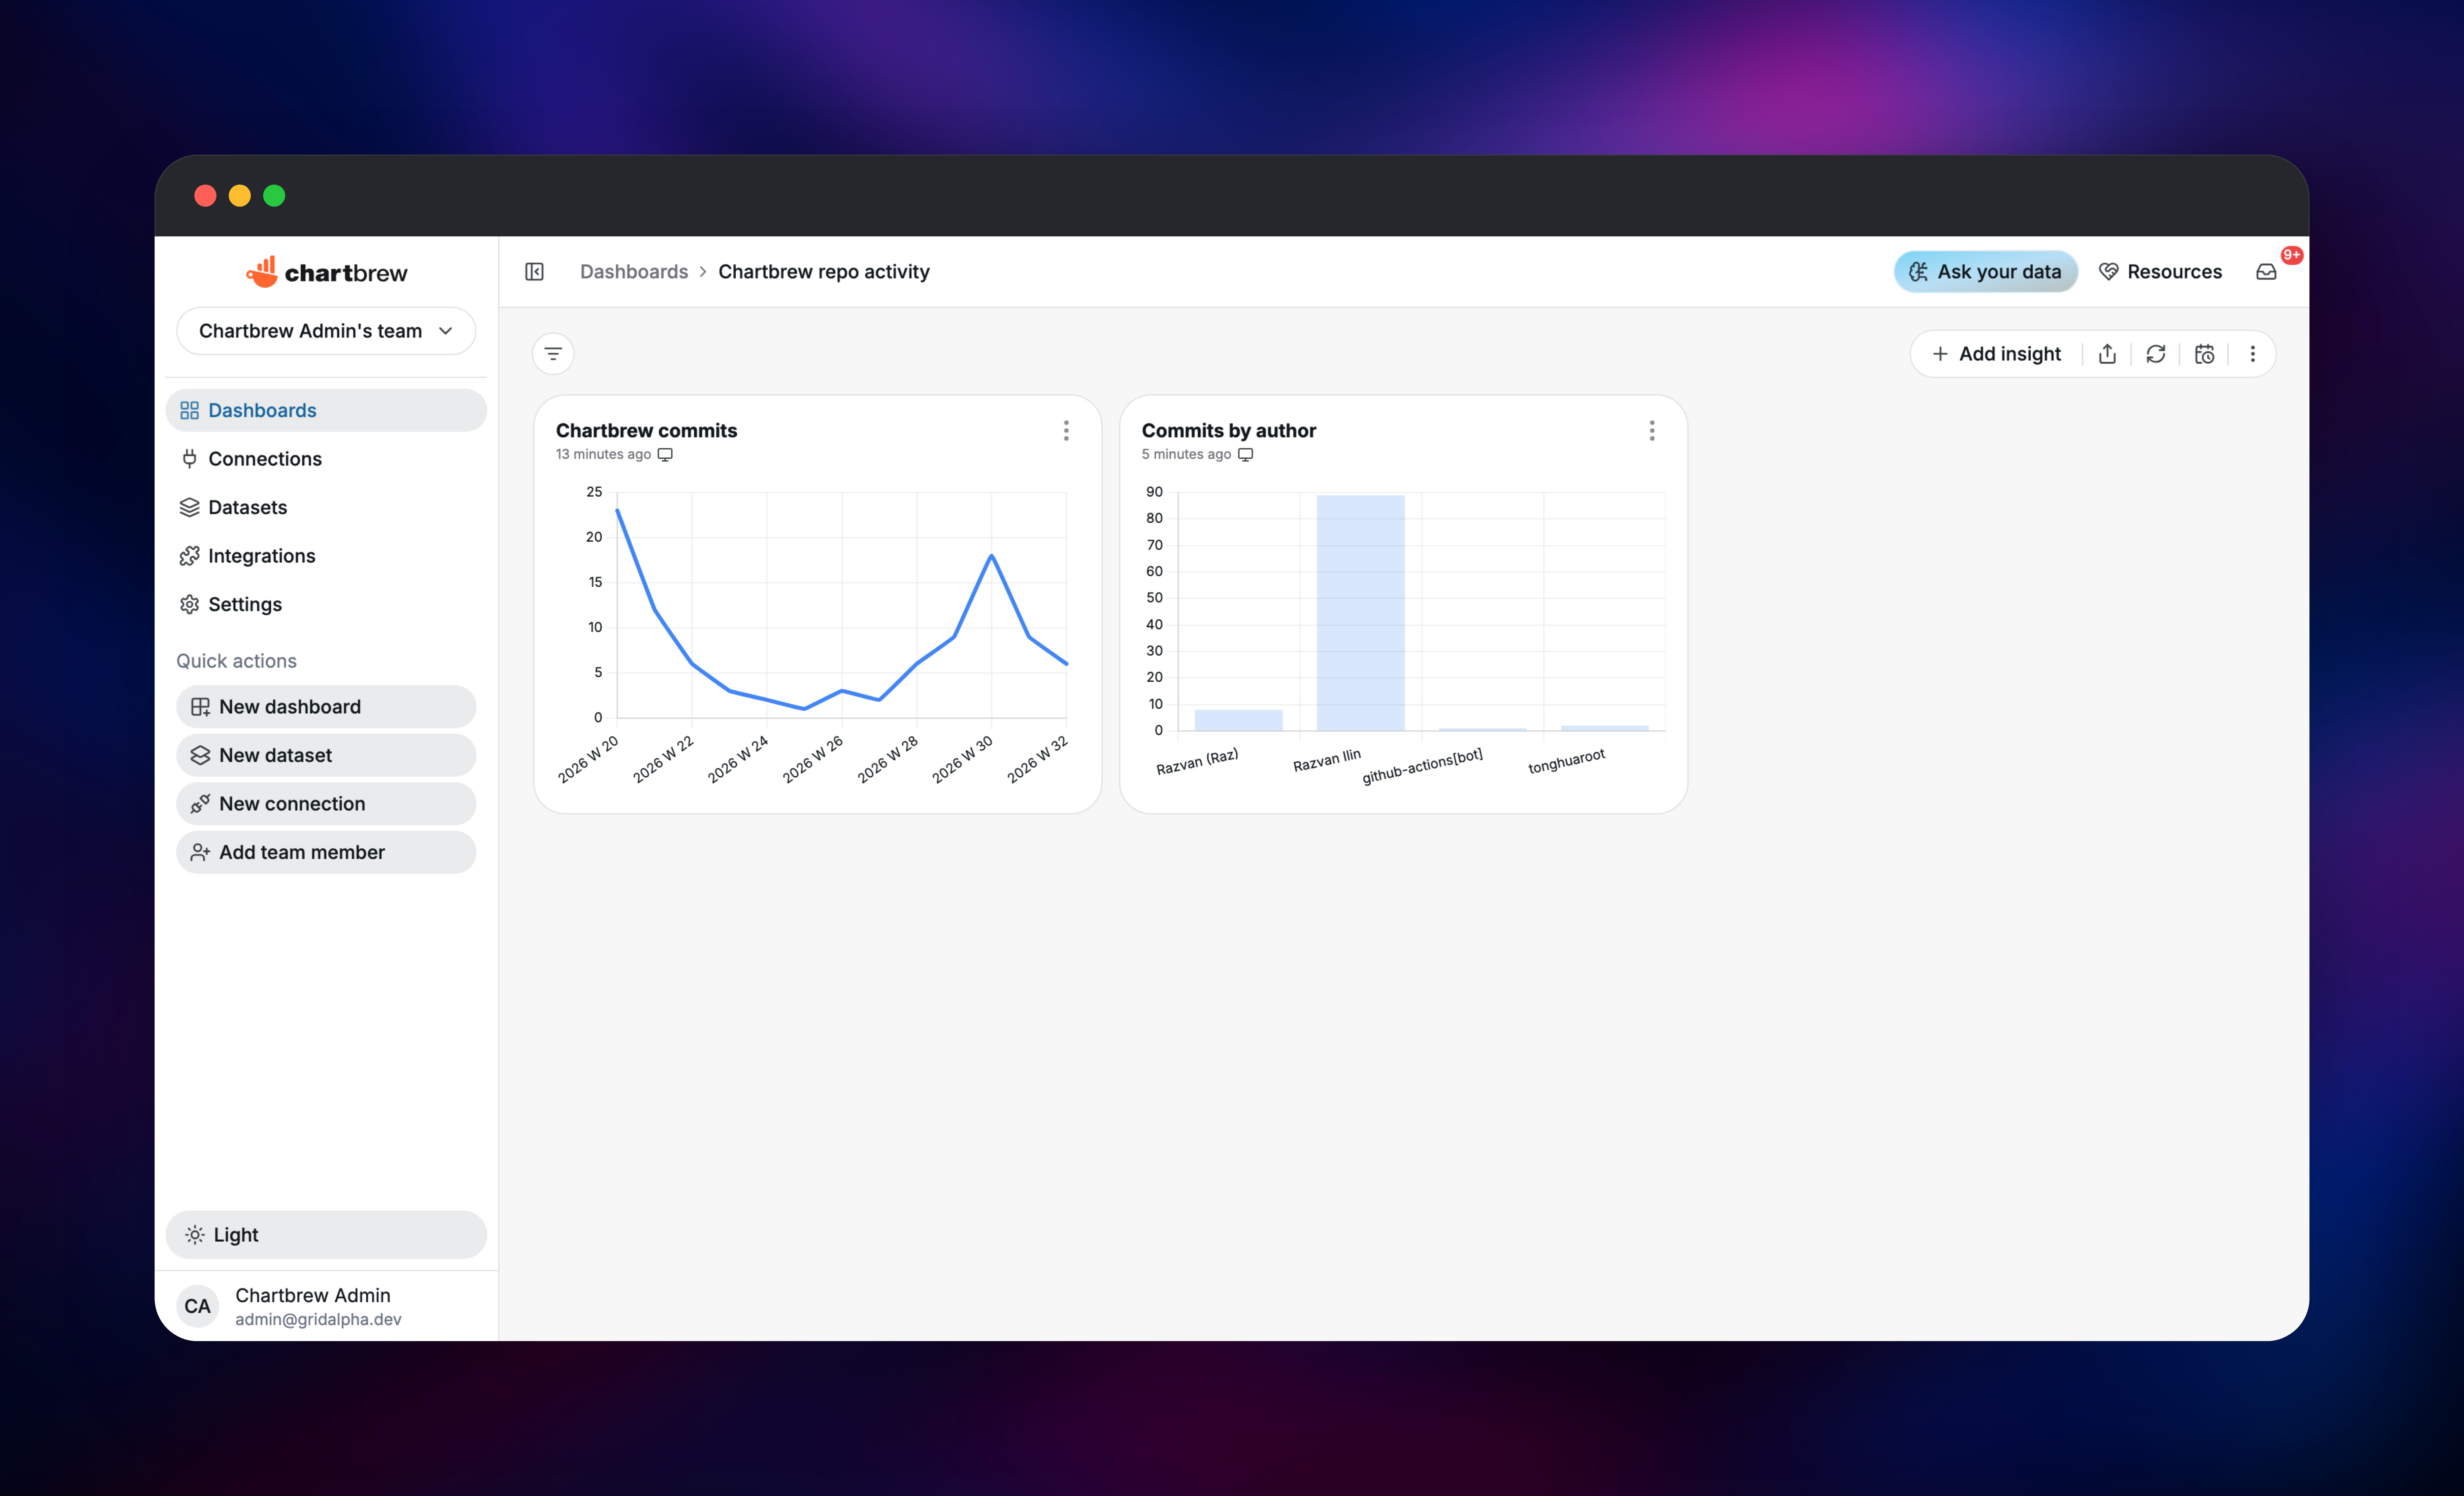
Set CB_INITIAL_ADMIN_EMAIL and CB_INITIAL_ADMIN_PASSWORD before you deploy. Chartbrew has no admin bootstrap of its own, so this template creates that account from those two variables before the API starts listening, and CB_RESTRICT_SIGNUP is 1, refusing every later signup — nobody can claim your instance while you are still reading this. Open the UI's public domain, sign in, and you land on a team with a starter dashboard.
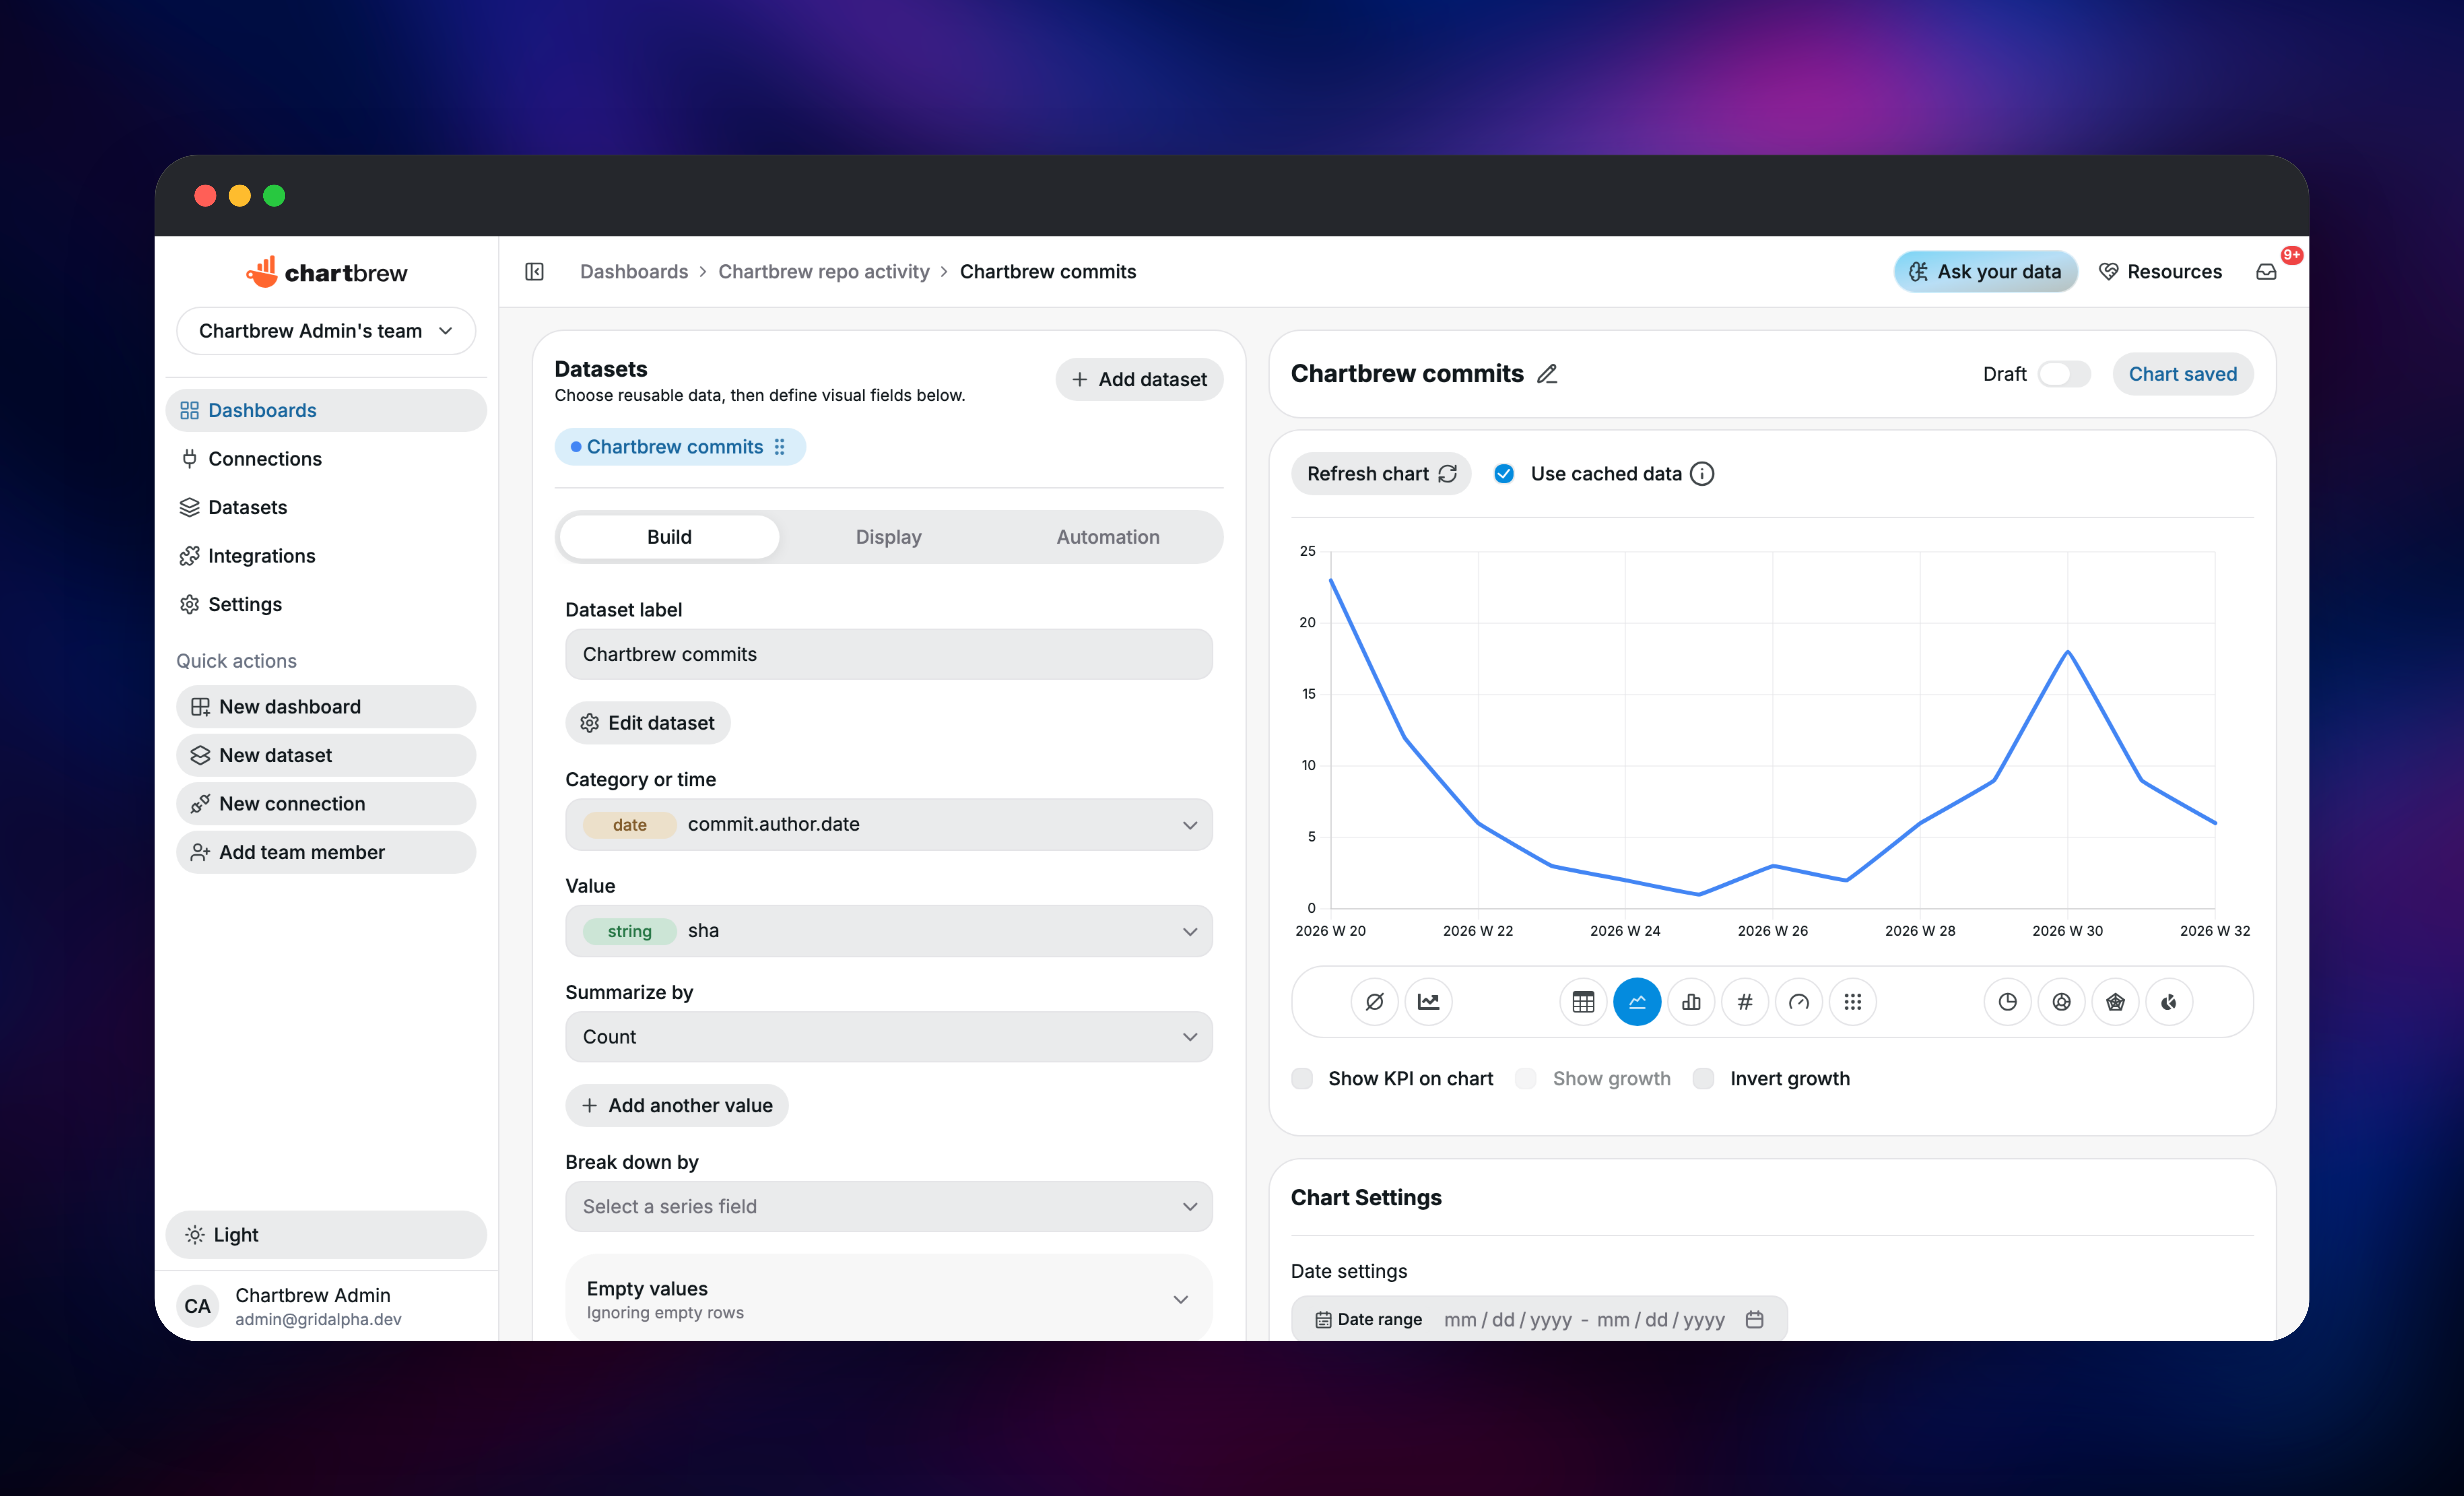
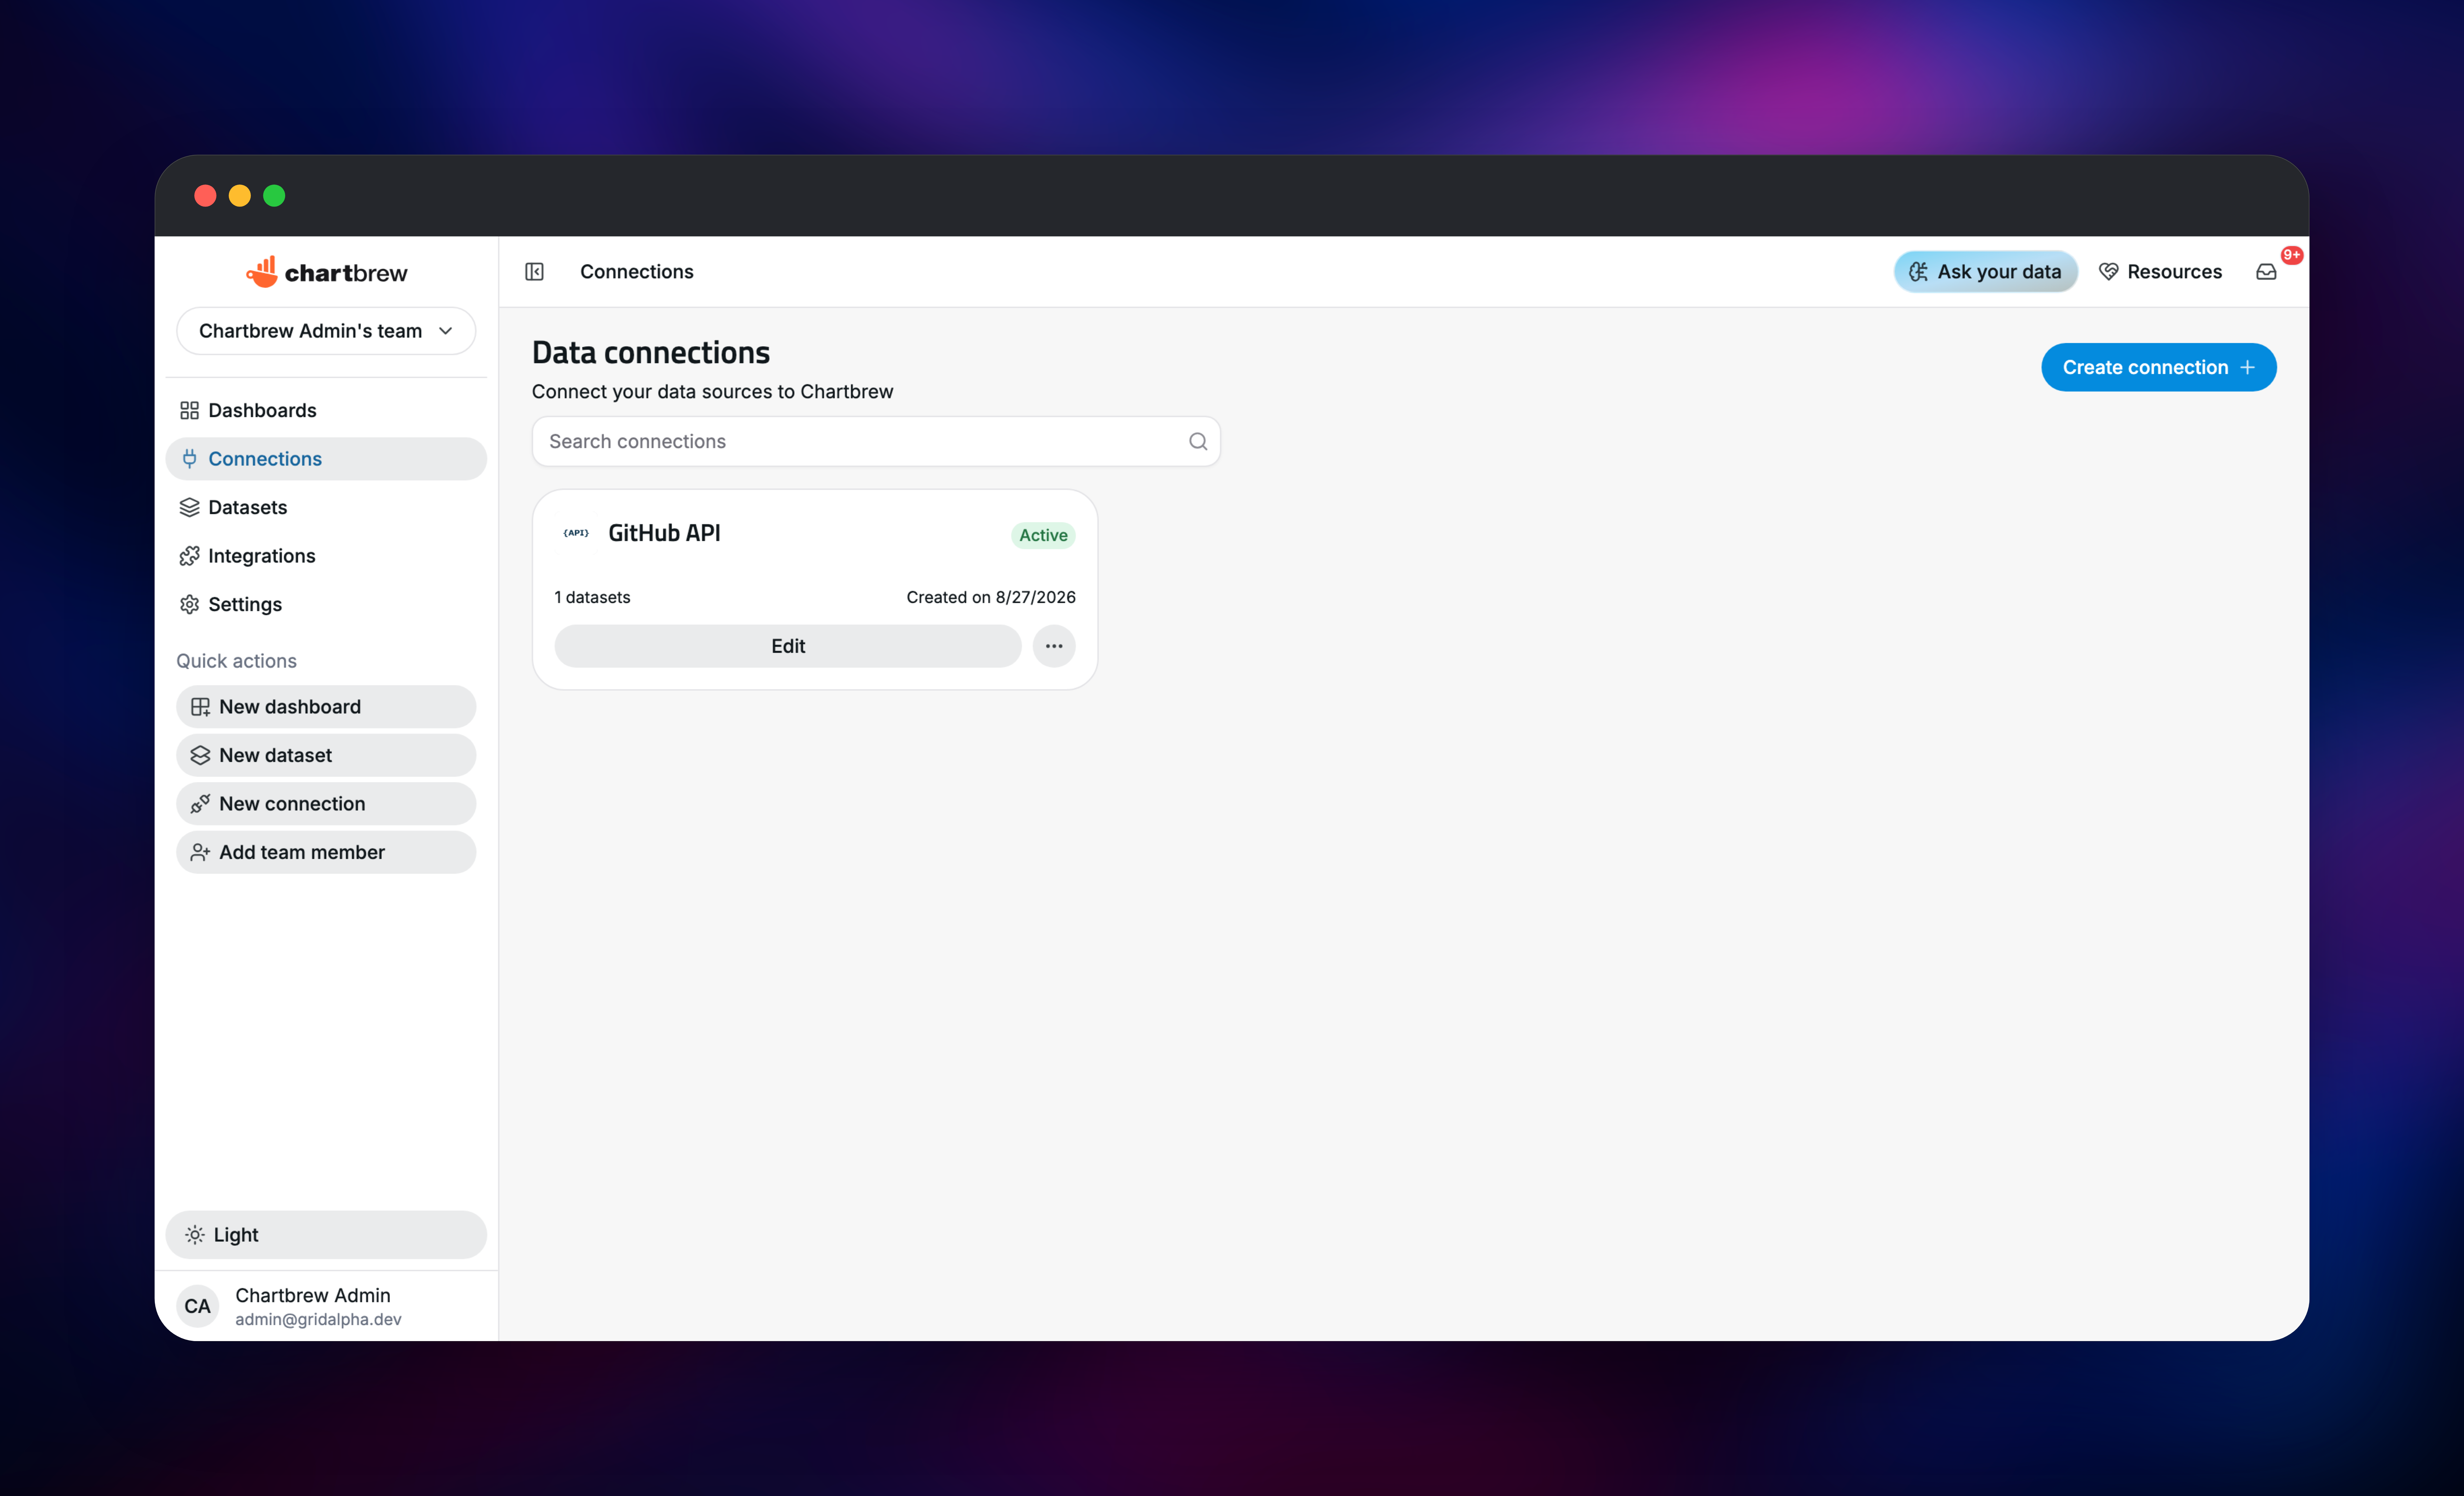
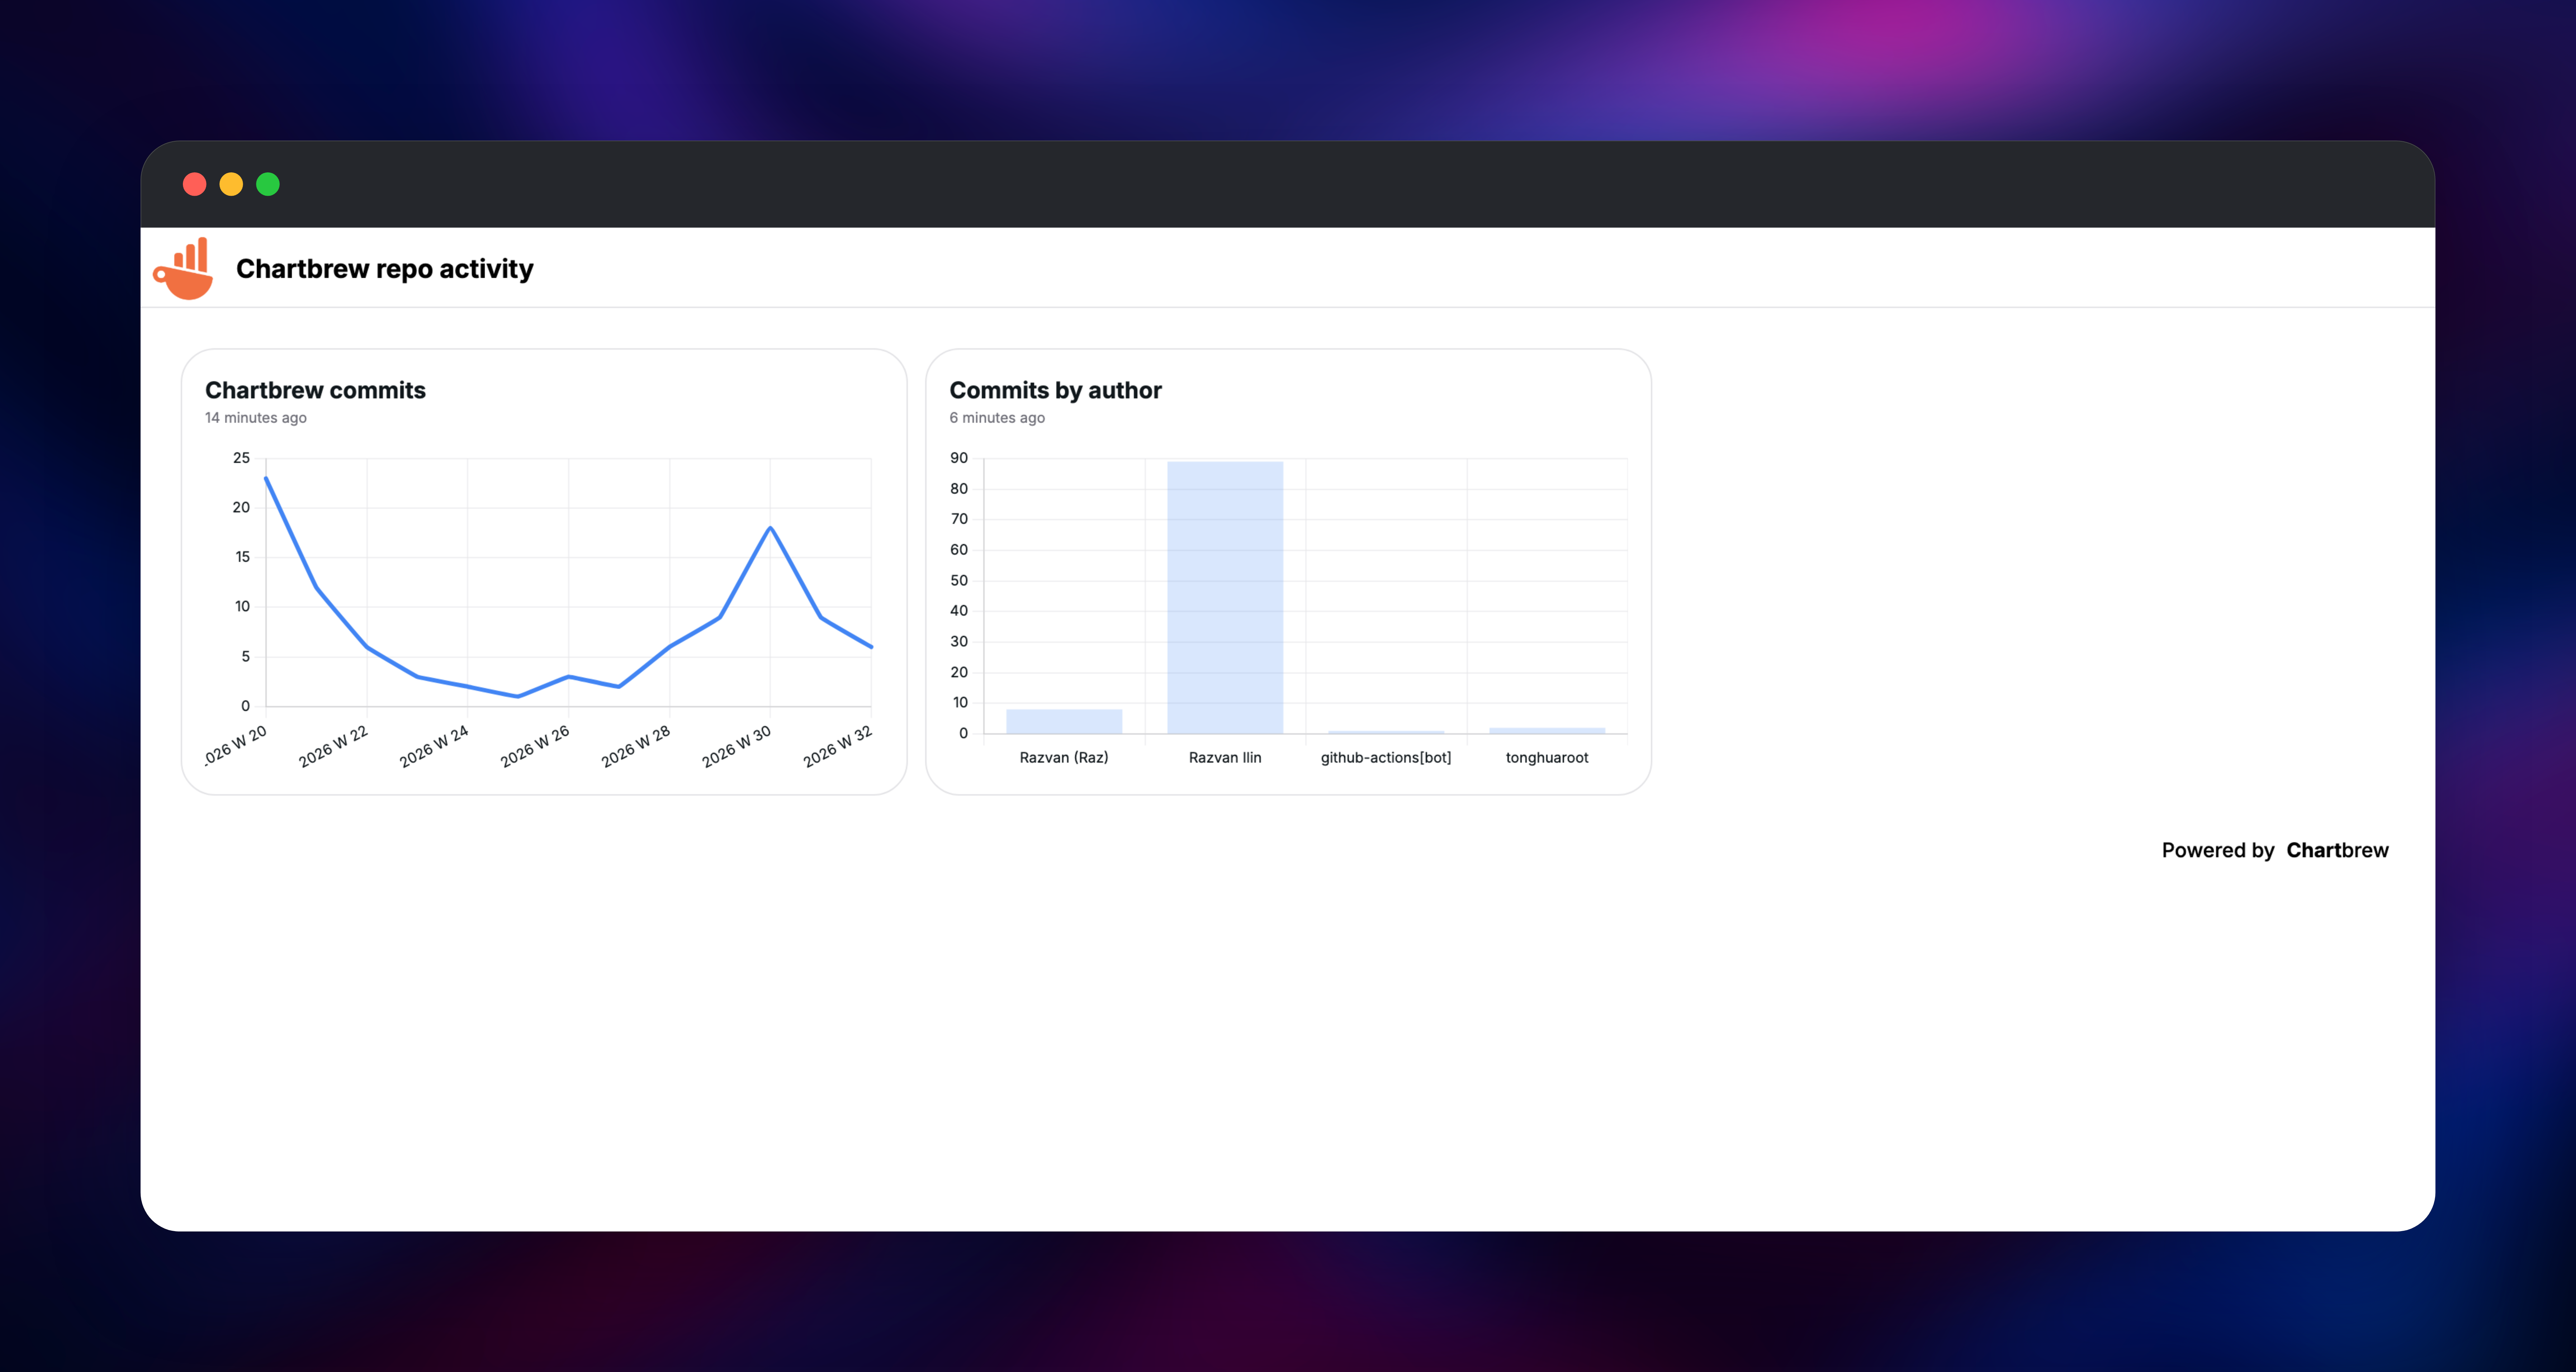
Click Connections → Create connection and pick a source from the grid — a REST API, a SQL or NoSQL database, or a SaaS connector. Test connection confirms Chartbrew can reach it before saving. Then create a dataset — a route and method for an API, a query for a database — and press Send the request to see the raw response. Save & create chart opens the builder, where you pick a category or time field, a value field and an aggregation such as Count or Sum, then toggle Draft off to publish. To check the deployment end to end, make the dashboard public and open its /b/ link in a private window: if the charts render for a signed-out visitor, everything works.
About Hosting Chartbrew
Chartbrew sits between a raw query tool and a full BI suite. Its unit of reuse is the dataset: one saved request or query several charts read from, so changing the query updates every chart built on it. Self-hosting matters because what you connect it to is usually your production database or an internal API — the credentials and cached results stay in your infrastructure.
Key features:
- Connectors for REST APIs, PostgreSQL, MySQL, MongoDB, Firestore, ClickHouse, Timescale, Supabase, Google Analytics, Stripe and Jira
- Reusable datasets with joins, filters, variables and formula fields
- Line, bar, pie, doughnut, radar, table, KPI and gauge charts
- Public, password-protected and embeddable dashboards
- Scheduled refreshes and snapshot reports by email or Slack
- Teams with per-member roles, and an optional AI chart assistant
The UI service is a static bundle; the API owns every database call, every request to your data sources, and the cron jobs that refresh charts on schedule. Postgres stores structure and credentials, encrypted at rest with a key you control. Redis holds the job queues, the query cache and the realtime adapter.
Why Deploy Chartbrew on Railway
Railway removes the setup work self-hosting Chartbrew normally involves:
- Postgres and Redis are provisioned and wired to the app on first deploy
- Both public services get HTTPS domains, with no reverse proxy to configure
- The volume for logos and chart snapshots is attached for you
- Private networking keeps the database and cache off the public internet
- Redeploys are a git push, and every service scales independently
Common Use Cases
- Client reporting: a password-protected dashboard link per customer, not a monthly PDF
- Product metrics: chart signups, revenue and usage from your production Postgres or MySQL
- API monitoring: turn a JSON endpoint into a time series, no collector needed
- Embedded analytics: put charts in your own app, keeping the data on your servers
Dependencies for Chartbrew
- Chartbrew UI and API — both built from gridalpha/chartbrew-railway, a thin image over the official
razvanilin/chartbrewrelease - PostgreSQL 18 — dashboards, datasets and encrypted connection credentials
- Redis 8 — BullMQ queues for scheduled refreshes, the query cache, the realtime adapter
Environment Variables Reference
| Variable | Service | Purpose |
|---|---|---|
CB_INITIAL_ADMIN_EMAIL | API | Email for the account created on first boot |
CB_INITIAL_ADMIN_PASSWORD | API | Its password; read only while the database is empty |
CB_ENCRYPTION_KEY | API | 64-hex-character key signing sessions and encrypting credentials |
CB_RESTRICT_SIGNUP | API | 1 blocks every signup after the first account |
CB_ALLOW_PRIVATE_NETWORK_CALLS | API | true lets Chartbrew query private-network hosts |
CB_MAIL_HOST / CB_MAIL_USER / CB_MAIL_PASS | API | SMTP for invites and snapshot reports |
VITE_APP_API_HOST | UI | Public URL of the API service |
VITE_APP_CLIENT_HOST | Both | Public URL of the UI service |
Deployment Dependencies
- Source: chartbrew/chartbrew · image: razvanilin/chartbrew
- Docs: docs.chartbrew.com · Runtime: Node.js 22
Hardware Requirements for Self-Hosting Chartbrew
| Resource | Minimum | Recommended |
|---|---|---|
| CPU | 1 vCPU | 2 vCPU |
| RAM | 1 GB API, 512 MB UI | 2 GB API |
| Storage | 1 GB volume plus the database | 5 GB volume |
| Runtime | Node.js 22, PostgreSQL 16+, Redis 7+ | — |
Memory follows how much data your queries return, not the number of dashboards.
Self-Hosting Chartbrew with Docker
Chartbrew publishes an official image running the API on 4019 and the UI on 4018. A minimal Docker Compose file with PostgreSQL and Redis:
services:
  chartbrew:
    image: razvanilin/chartbrew
    ports: ["4018:4018", "4019:4019"]
    environment:
      CB_DB_DIALECT: postgres
      CB_DB_HOST: db
      CB_DB_NAME: chartbrew
      CB_DB_USERNAME: chartbrew
      CB_DB_PASSWORD: change-me
      CB_REDIS_HOST: redis
      CB_ENCRYPTION_KEY: replace-with-64-hex-chars
      CB_API_HOST: 0.0.0.0
      VITE_APP_CLIENT_HOST: http://localhost:4018
      VITE_APP_API_HOST: http://localhost:4019
  db: { image: postgres:18 }
  redis: { image: redis:8-alpine }
To build from source, clone the repository and run the setup script:
git clone https://github.com/chartbrew/chartbrew.git
cd chartbrew && npm run setup
npm run start
The encryption key must be exactly 64 hexadecimal characters — openssl rand -hex 32 produces one. Both VITE_APP_* values are baked into the frontend at build time, which is why the Railway template rewrites the bundle when those domains change.
How Much Does Chartbrew Cost to Self-Host?
Chartbrew is free to self-host under the Functional Source License 1.1 with an MIT future grant: you may self-host it, modify it and embed its dashboards in a commercial product, and each release becomes MIT two years after it ships. The one restriction is reselling Chartbrew itself as a hosted service. Its own cloud starts at $24/month for 10 dashboards and 3 team members, so a Railway instance pays for itself quickly — you pay only for compute, database and volume.
Chartbrew vs Metabase and Redash
| Chartbrew | Metabase | Redash | |
|---|---|---|---|
| REST API as a source | Yes | No | Limited |
| Embeddable dashboards | Yes | Paid for signed embeds | Yes |
| Footprint | Node.js, ~1 GB | JVM, ~2 GB | Python, multi-service |
Pick Chartbrew when much of your data lives behind HTTP APIs rather than a warehouse.
FAQ
What is Chartbrew?
An open-source business intelligence tool that connects to APIs, SQL and NoSQL databases and turns them into live charts and shareable dashboards.
Why does the template include PostgreSQL and Redis?
Postgres stores dashboards, datasets and encrypted data-source credentials. Redis backs the BullMQ queues behind scheduled chart refreshes, the query cache, and the realtime channel that reports progress to the browser.
How do I create the first user in self-hosted Chartbrew?
Set CB_INITIAL_ADMIN_EMAIL and CB_INITIAL_ADMIN_PASSWORD before deploying. That account is created on first boot and, with CB_RESTRICT_SIGNUP=1, is the only one creatable without an invite.
Can Chartbrew query another database running on Railway?
Yes. Set CB_ALLOW_PRIVATE_NETWORK_CALLS to true on the API service and use the target's *.railway.internal hostname. It is off by default because the same guard blocks server-side request forgery.
Template Content