Deploy Self-Hosted Uptime Monitoring & Status Page on Railway — Gatus
Self-host Gatus: uptime monitoring & status page. No per-endpoint fees.
Just deployed
/data
Deploy and Host Gatus on Railway
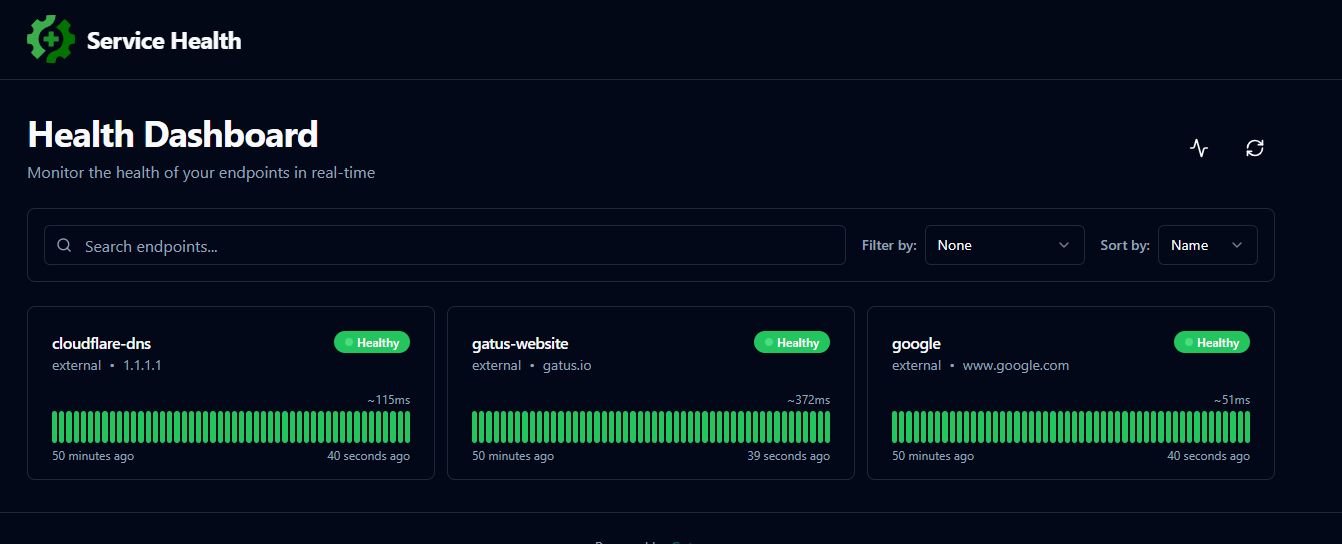
Gatus is an open-source, developer-oriented health dashboard with 10k+ GitHub stars — monitor HTTP, ICMP, TCP, DNS, GraphQL endpoints and TLS certificate expiry from a single YAML config file. Built-in status page, Prometheus metrics export, and native alerts to Slack, Discord, Teams, PagerDuty, Twilio, and 20+ providers. Every monitor is code — version- controlled, GitOps-friendly, and deployable in seconds.
Self-host on Railway for ~$2–5/month. Pingdom charges $15–100+/month for basic uptime checks. Better Uptime starts at $29/month. Gatus gives you unlimited endpoints, unlimited alert rules, and a public status page at flat Railway compute cost with zero per-endpoint fees.
What This Template Deploys
| Service | Purpose |
|---|---|
| Gatus | The monitoring engine — endpoint health checks, status page UI, Prometheus metrics endpoint, and alert delivery on port 8080 |
| PostgreSQL | Persistent storage for uptime history, response time data, and status page records — survives every redeploy |
Single lightweight Go binary. No Node.js, no Redis, no additional services. Gatus uses ~10 MB of RAM at idle — the most resource-efficient monitoring stack on Railway.
About Hosting Gatus
Running Gatus in production requires a persistent database for uptime history, a public HTTPS endpoint for the status page and badge embeds, and secure environment variable handling for alerting credentials. Without a managed host, you're configuring Docker, volume mounts, SSL, and process restarts manually.
Railway provisions all of it. Gatus deploys as a single container connected to Railway-managed PostgreSQL over private networking. Your YAML config — stored in the repository you fork — defines every monitor and alert rule. Push a config change and Railway auto-deploys it.
Typical cost: ~$2–5/month on Railway's Hobby plan for Gatus and PostgreSQL. Pingdom Standard charges $15/month for 10 uptime checks with 1-minute intervals. Better Uptime starts at $29/month. Gatus on Railway monitors unlimited endpoints at any interval you configure — no per-endpoint pricing, no tier limits.
Deploy in Under 5 Minutes
- Click Deploy on Railway — Gatus and PostgreSQL build automatically (~2–3 minutes)
- Fork the Gatus Railway repo and add your
config/config.yamlwith your endpoints - Connect your forked repo to the Railway Gatus service under Settings → Source
- Set your alerting credentials (Slack webhook, Discord webhook, etc.) as Railway Variables
- Open your Railway URL — the Gatus status page is live immediately
No SSH. No Docker configuration. Push a config change, Railway redeploys automatically.
Common Use Cases
- Self-hosted alternative to Pingdom — replace $15–100+/month with flat Railway compute; monitor unlimited endpoints with 30-second intervals and TLS certificate expiry alerts
- Self-hosted alternative to Uptime Kuma — Gatus is YAML-based and GitOps-native; every monitor lives in version control, reviewable as a pull request, not a GUI
- Public status page for your product or API — Gatus serves a production-ready status page at your Railway domain; embed uptime badges in your README or docs site
- DevOps health checks as code — define HTTP response conditions, DNS resolution checks, TCP port probes, and certificate expiry warnings in YAML alongside your infrastructure code
- Internal service monitoring behind private network — monitor internal Railway services over private networking without exposing them to external monitoring SaaS
- Prometheus-compatible monitoring pipeline — Gatus exports metrics at
/metrics; scrape with Prometheus and visualise in Grafana without any additional exporters
Configuration
| Variable | Required | Description |
|---|---|---|
DATABASE_URL | ✅ Auto-injected | PostgreSQL connection string — injected from Railway PostgreSQL service |
SLACK_WEBHOOK_URL | Optional | Slack incoming webhook for downtime and recovery alerts |
DISCORD_WEBHOOK_URL | Optional | Discord webhook URL for alert delivery |
PAGERDUTY_INTEGRATION_KEY | Optional | PagerDuty routing key for on-call incident creation |
TEAMS_WEBHOOK_URL | Optional | Microsoft Teams webhook for alert notifications |
TWILIO_ACCOUNT_SID | Optional | Twilio account SID for SMS alerts |
TWILIO_AUTH_TOKEN | Optional | Twilio auth token for SMS alerts |
CUSTOM_HEADER_VALUE | Optional | Custom header value referenced in config.yaml for authenticated endpoint monitoring |
All monitoring configuration — endpoints, conditions, alert rules, intervals — is defined in
config/config.yamlin your forked repository. Reference environment variables in the config using$ENV_VAR_NAMEsyntax. Credentials never go in the config file directly.
Gatus vs. Uptime Monitoring Alternatives
| Gatus (Railway) | Pingdom | Better Uptime | Uptime Kuma | |
|---|---|---|---|---|
| Monthly cost | ~$2–5 flat | From $15/month | From $29/month | Free (self-hosted) |
| Per-endpoint limit | ✅ Unlimited | ❌ 10 on Standard | ❌ Capped by plan | ✅ Unlimited |
| Check interval | ✅ Any (30s default) | ❌ 1 min minimum | ❌ 1 min minimum | ✅ Any |
| Config as code (YAML) | ✅ GitOps-native | ❌ UI only | ❌ UI only | ❌ UI only |
| DNS monitoring | ✅ Yes | ✅ Yes | ❌ No | ❌ No |
| TCP monitoring | ✅ Yes | ✅ Yes | ❌ No | ✅ Yes |
| Certificate expiry | ✅ Yes | ✅ Yes | ✅ Yes | ✅ Yes |
| Prometheus metrics | ✅ Native /metrics | ❌ No | ❌ No | ✅ Yes |
| Self-hostable | ✅ Yes | ❌ No | ❌ No | ✅ Yes |
| Status page | ✅ Built-in | ✅ Add-on | ✅ Yes | ✅ Yes |
Dependencies for Gatus Hosting
- Railway account — Hobby plan (~$2–5/month) for Gatus and PostgreSQL
- A forked Gatus config repository with your
config/config.yaml - Optional alerting credentials — Slack, Discord, PagerDuty, Teams, Twilio, or any of 20+ supported alert providers
Deployment Dependencies
- Gatus GitHub Repository — source and releases
- Gatus Documentation — full config reference and alerting guides
- Gatus Configuration Reference — YAML schema
- Railway Volumes Documentation — persistent storage
Implementation Details
Gatus deploys from twinproduction/gatus:latest alongside Railway-managed PostgreSQL over
private networking. Gatus reads config/config.yaml at startup — each redeploy reloads
config automatically. Environment variables injected from Railway Variables at runtime keep
credentials out of version control. The Prometheus endpoint at /metrics is available on
port 8080. PostgreSQL stores all uptime history persistently across redeploys.
Frequently Asked Questions
How is Gatus different from Uptime Kuma? Uptime Kuma is GUI-based — you configure monitors by clicking through a web interface. Gatus is YAML-based — every monitor, condition, and alert rule is defined in a config file that lives in your Git repository. For DevOps and engineering teams, Gatus means monitoring changes go through pull requests, code review, and version history. For non-technical users who prefer clicking, Uptime Kuma is the better fit.
How much does Gatus cost compared to Pingdom or Better Uptime? Gatus on Railway runs at ~$2–5/month for the full stack with unlimited endpoints. Pingdom Standard costs $15/month for 10 uptime checks. Better Uptime starts at $29/month. Both cap check intervals at 1 minute. Gatus checks at any interval you configure — 30 seconds by default — with no per-endpoint or per-check fees.
Can I monitor internal Railway services that aren't publicly accessible?
Yes. Gatus connects to other Railway services over Railway's private internal network using
.railway.internal hostnames. You can monitor internal APIs, databases, and services without
exposing them publicly — something external SaaS monitors cannot do.
Does Gatus support alerting to PagerDuty or on-call tools?
Yes. Gatus has native integrations for PagerDuty, Opsgenie, Slack, Discord, Microsoft Teams,
Twilio (SMS), email, and 20+ other providers. Set your alerting credentials as Railway
Variables and reference them in your config.yaml — no credentials in the config file.
Do I lose uptime history if Railway redeploys? No. All uptime history and response time data are stored in Railway-managed PostgreSQL, not inside the Gatus container. Redeploys, updates, and container restarts do not affect your monitoring history.
Can I embed Gatus uptime badges in my README or documentation? Yes. Gatus generates embeddable SVG badges for each endpoint — link directly to your Railway domain's badge endpoint. The badge shows current status (up/down) and can be embedded in GitHub READMEs, docs sites, or any HTML page.
Why Deploy and Host Gatus on Railway?
Railway is a singular platform to deploy your infrastructure stack. Railway will host your infrastructure so you don't have to deal with configuration, while allowing you to vertically and horizontally scale it.
By deploying Gatus on Railway, you get a production-ready uptime monitoring platform — YAML-based endpoint health checks, a built-in public status page, Prometheus metrics, and 20+ alert integrations — at ~$2–5/month flat with unlimited endpoints and no per-check fees.
Template Content
GATUS_CONFIG_YAML
Optional full YAML, overrides default at boot