
Deploy Grafana
Datadog Alternative. Dashboards, alerts, PromQL, SQL, Loki, PNG export

Redis
Just deployed
/data

Just deployed
/var/lib/postgresql/data
image-renderer
Just deployed
Grafana
Just deployed
/var/lib/grafana
Deploy and Host Grafana on Railway
Grafana is the open source dashboarding and alerting layer most engineering teams put in front of their metrics, logs and traces. It queries data where it already lives — Prometheus, PostgreSQL, MySQL, Loki, Elasticsearch, ClickHouse, InfluxDB, CloudWatch and a hundred more — and turns it into shared dashboards, ad-hoc exploration and alert rules. Teams self-host Grafana as the answer to Datadog when per-host or per-series billing stops making sense.
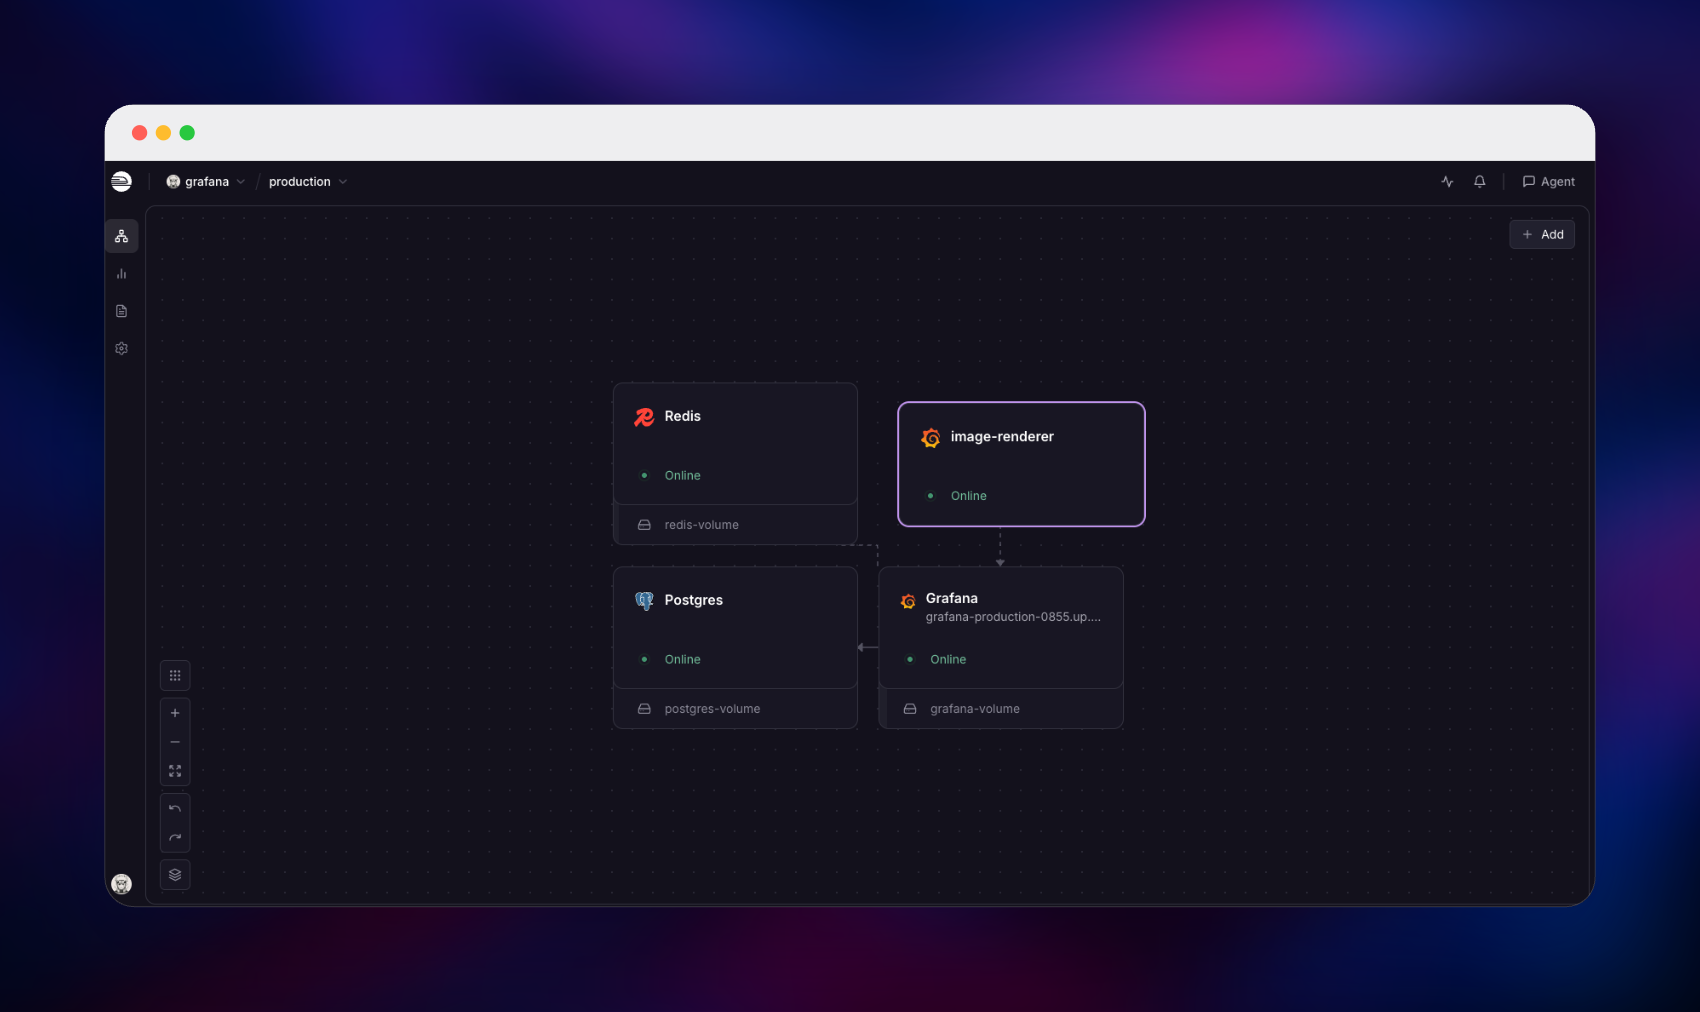
Deploy Grafana on Railway in the shape its own docs call production, not as one container with a SQLite file inside it. This template runs grafana/grafana behind a managed public URL, keeps every dashboard, user, API key and data source in managed PostgreSQL, uses managed Redis as the remote cache, and runs grafana/grafana-image-renderer privately so image export works. A volume at /var/lib/grafana holds plugins and generated files across restarts.
Getting Started with Grafana on Railway
Set GF_SECURITY_ADMIN_PASSWORD before deploying — it is the one value you supply, and it becomes the password for the built-in admin account. Once the deploy is green, open the public URL and sign in as admin. There is no signup link: open registration and anonymous access are both off, so colleagues are added under Administration → Users and access, where OAuth is configured too.
The first useful action is connecting data. Under Connections → Data sources, pick a type and point it at a host. Anything else in the project answers privately at servicename.railway.internal, so a PostgreSQL data source aimed at postgres.railway.internal:5432 needs no public exposure. Hit Save & test to confirm.
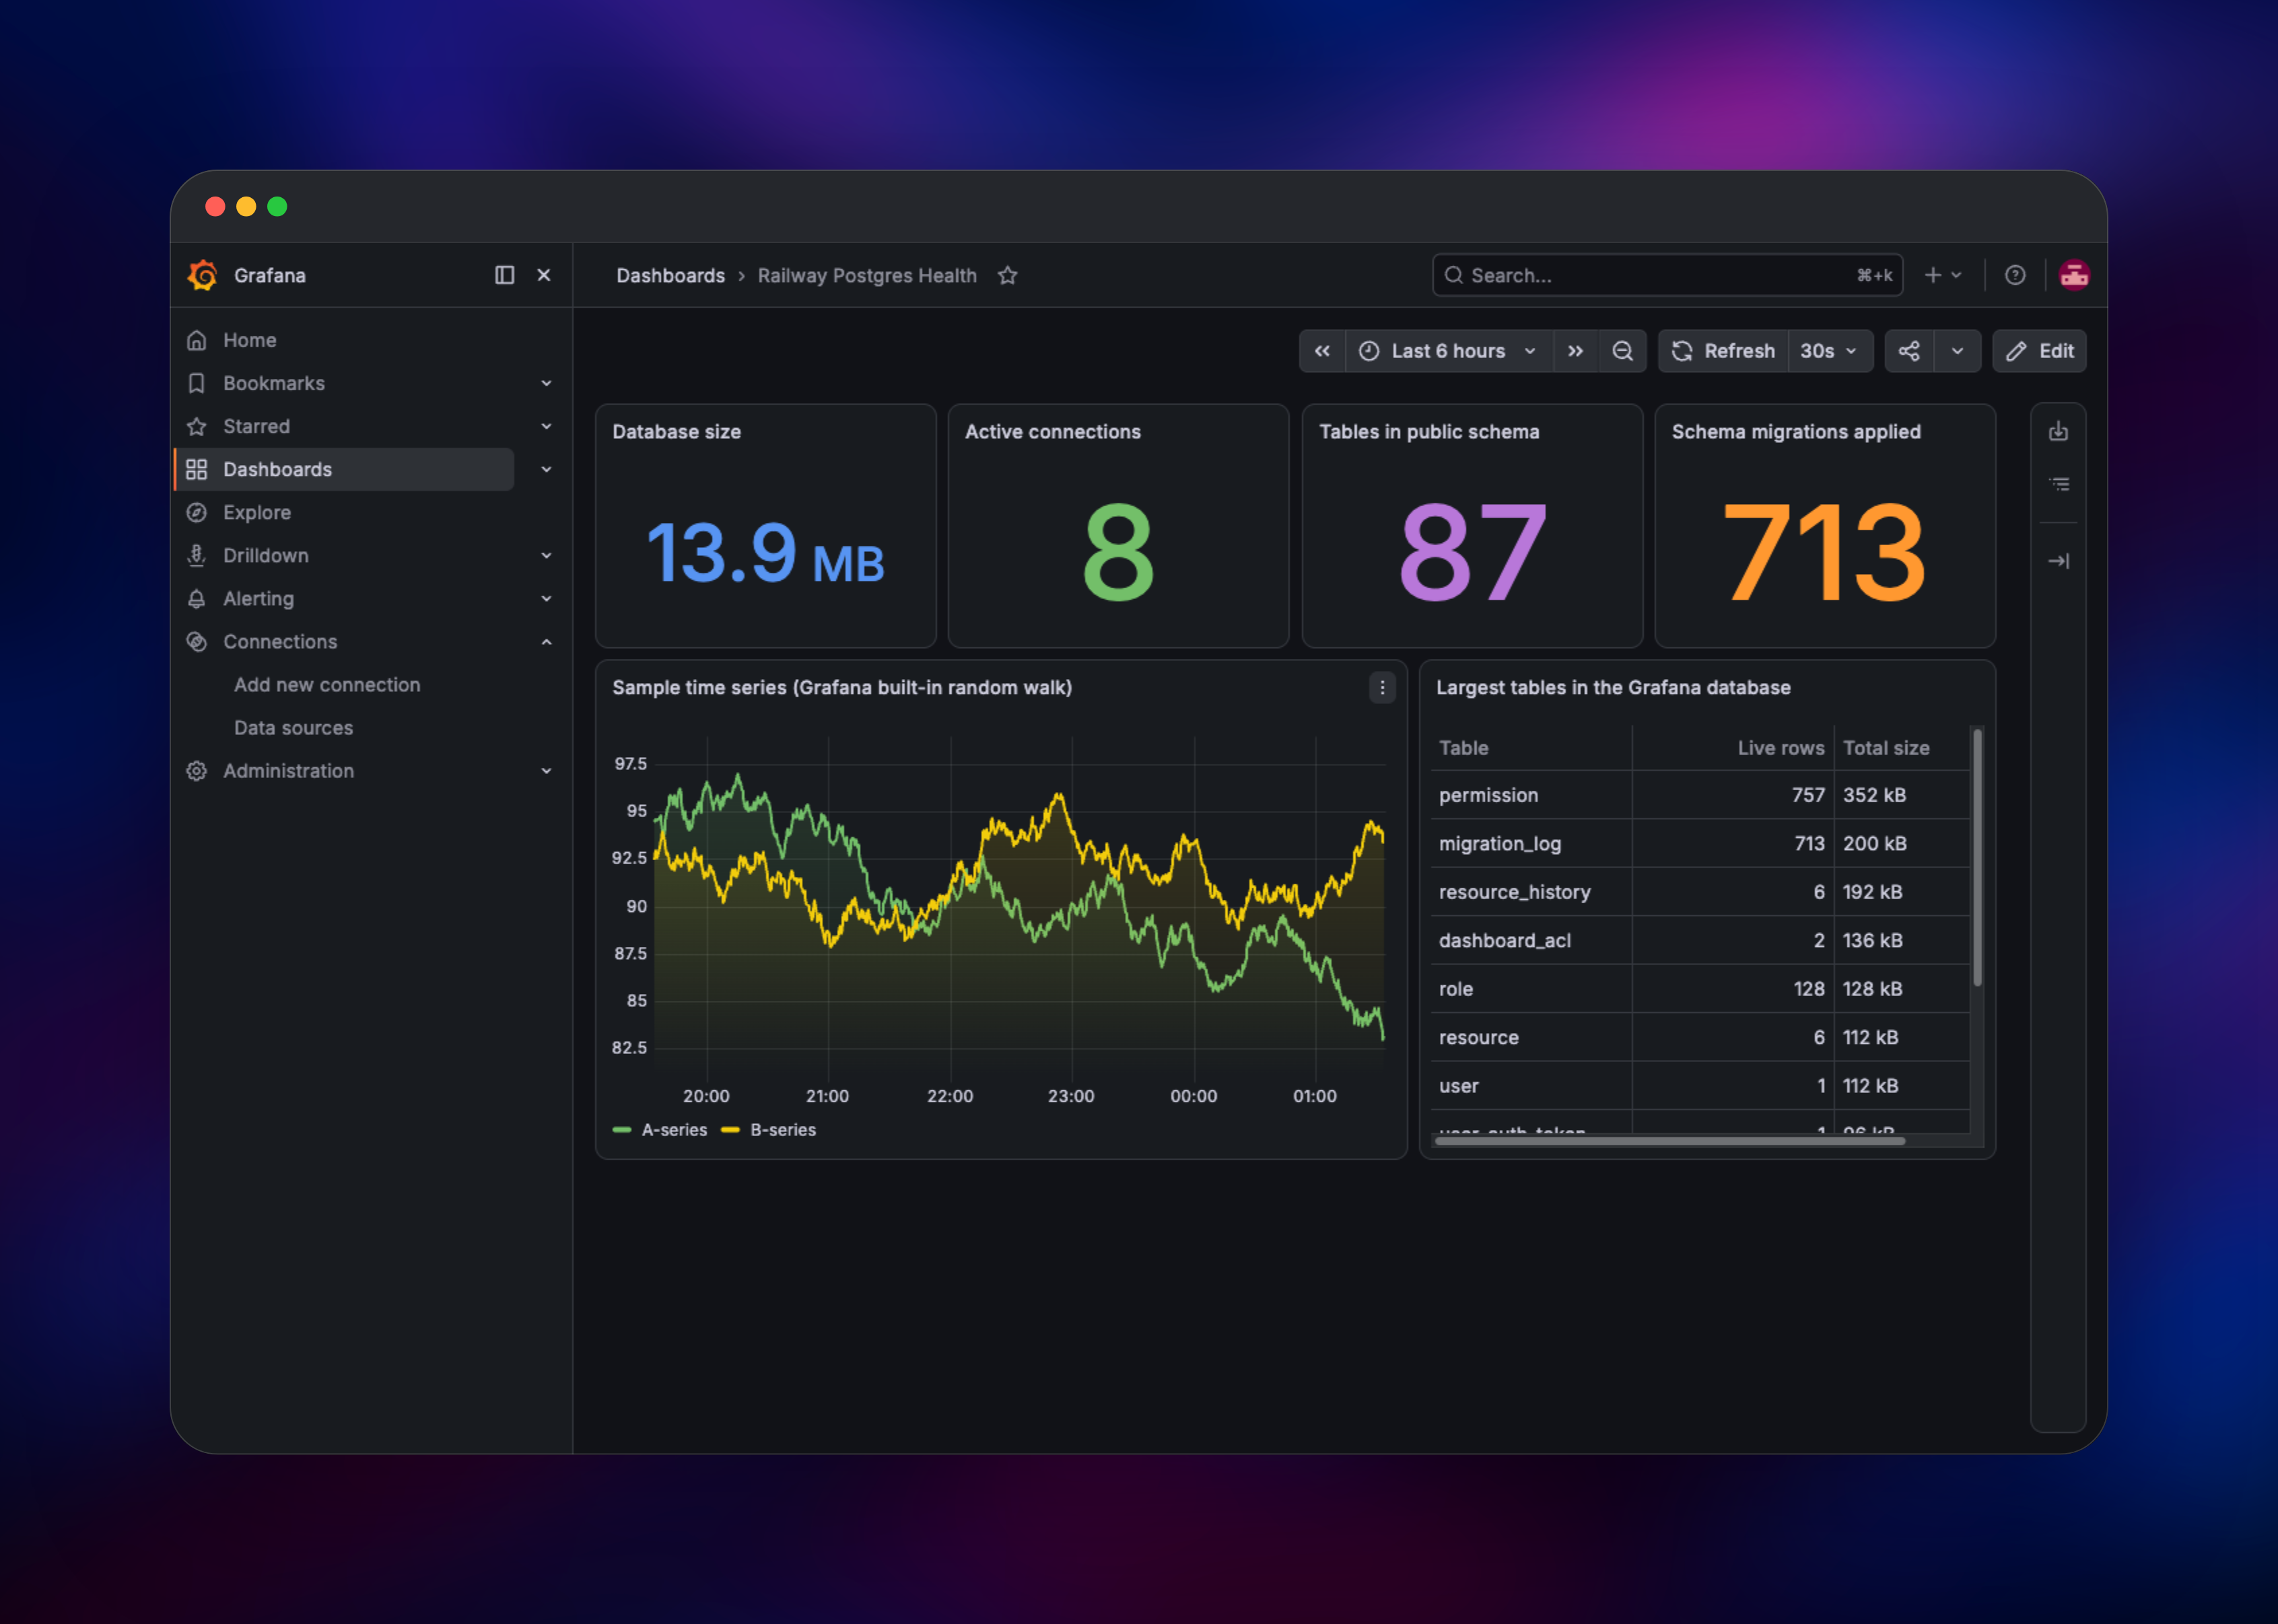
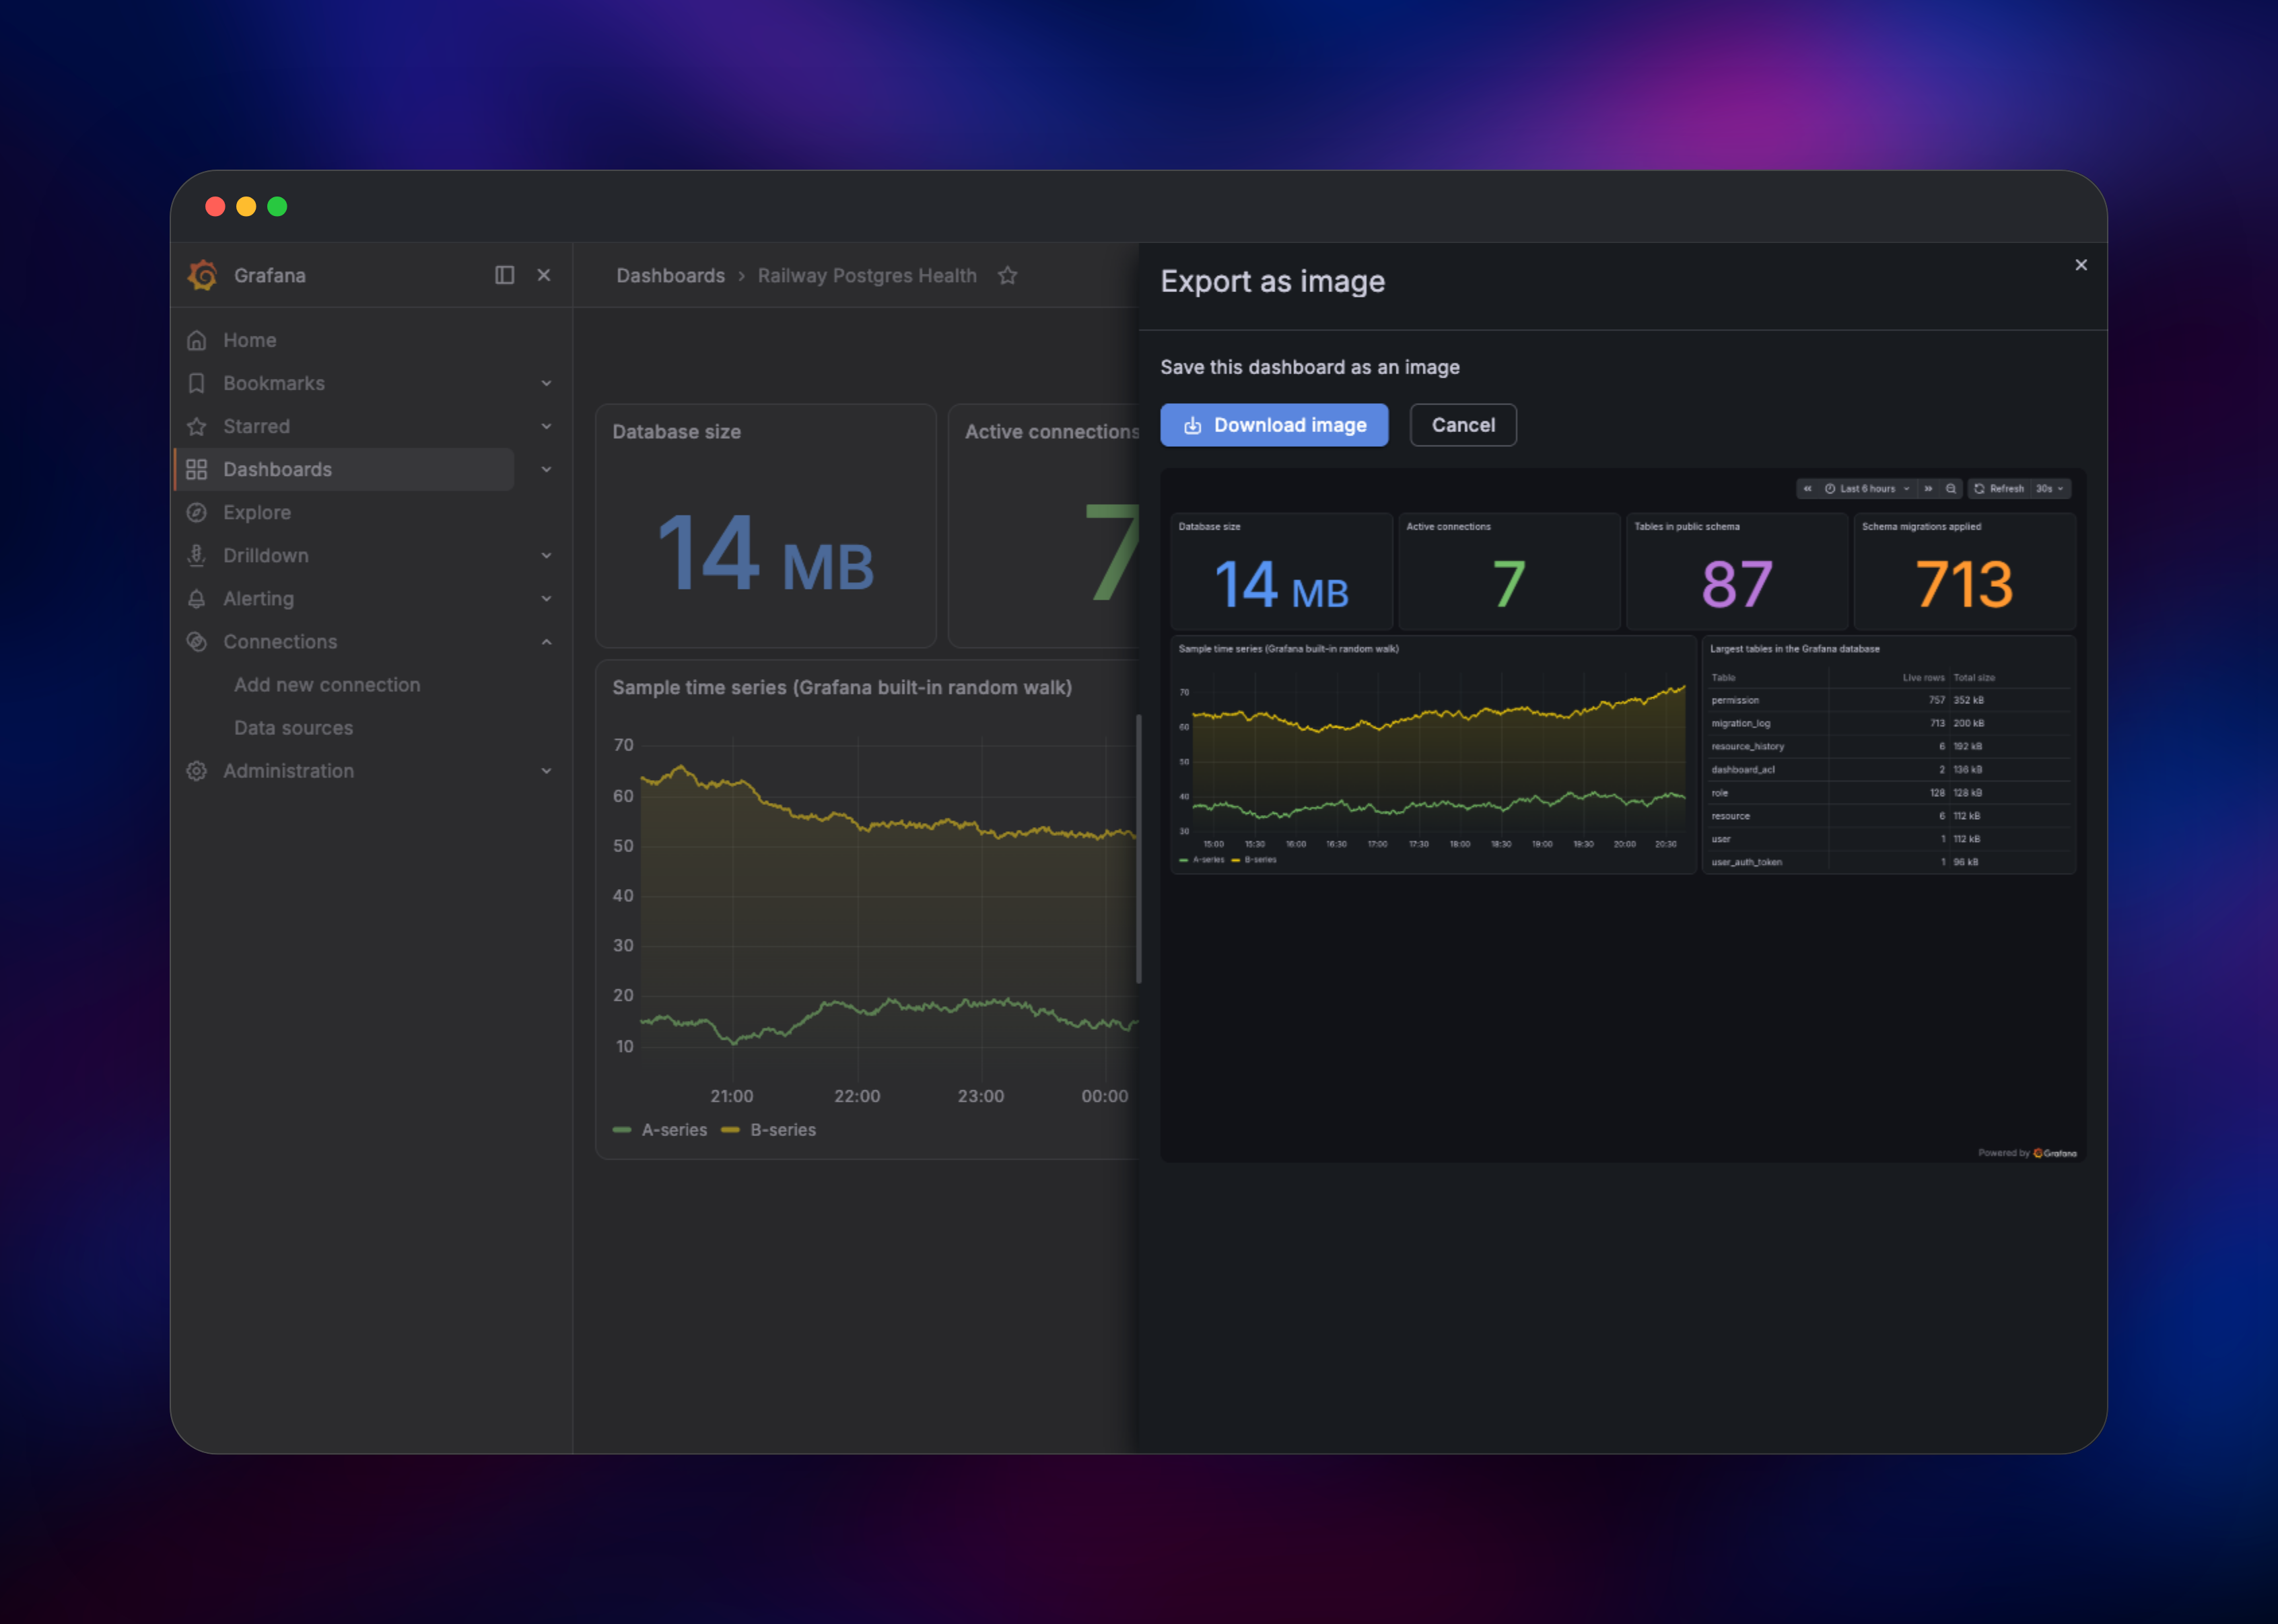
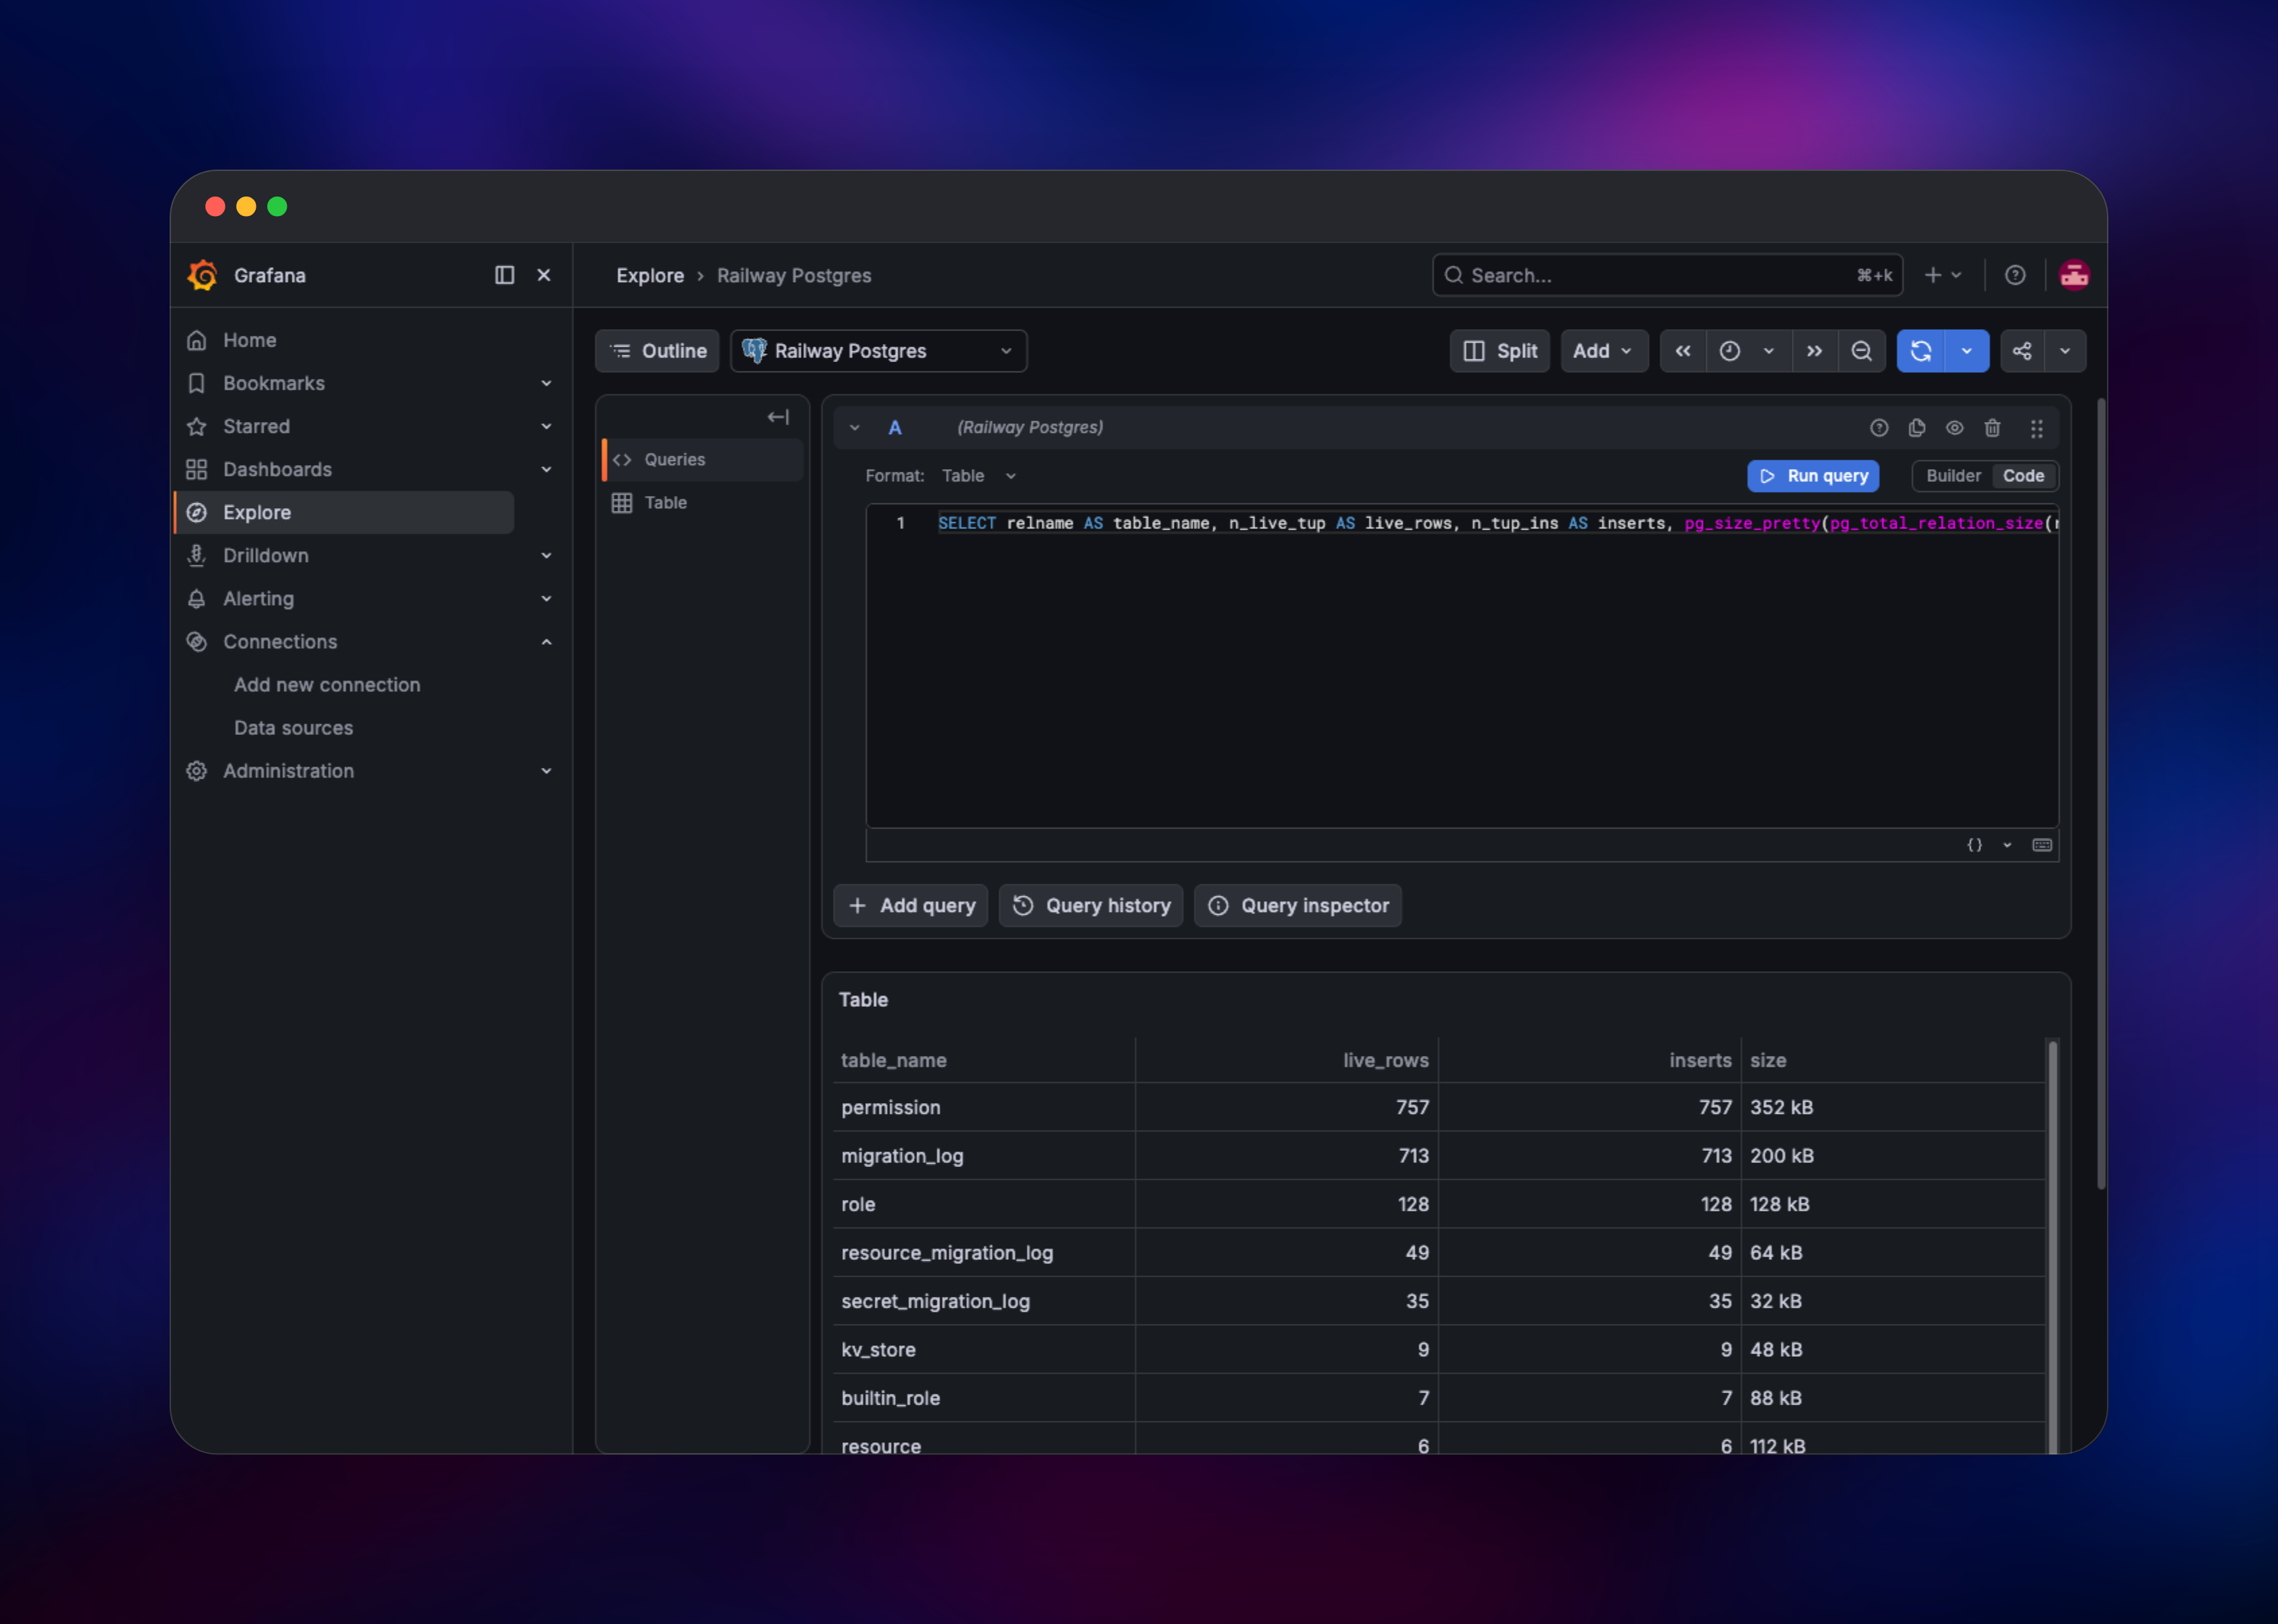
Then get a dashboard on screen: Dashboards → New → Import accepts any ID from the community library, and Explore runs raw queries before you commit them to a panel. To check the renderer, open a dashboard and pick Export → Export as image; a PNG preview means Grafana reached it.
About Hosting Grafana
Grafana is a Go binary with a React frontend that owns no data of its own. It keeps configuration in a database and queries everything else live, so self-hosting is cheap: you run a query layer, not a second copy of your telemetry.
Key features:
- Dashboards over 100+ data sources, mixed freely on one panel
- Unified alerting to Slack, PagerDuty, email, Teams and webhooks
- Explore mode for ad-hoc PromQL, LogQL and SQL, no panel required
- Teams, folder permissions, API keys and OAuth/LDAP/SAML login
How the services fit together. Grafana is the only public one, serving the UI and API on port 3000. PostgreSQL replaces the default SQLite file and holds dashboards, users, sessions and encrypted data source credentials, so a redeploy neither logs you out nor loses work. Redis is the remote cache. image-renderer is headless Chromium; the in-process rendering plugin is deprecated upstream, so a separate container is the supported path.
Why Deploy Grafana on Railway
Production Grafana normally means running a database, cache and browser container yourself.
- Managed PostgreSQL and Redis, provisioned and wired in
- Private networking between all four services by default
- Volume for plugins and rendered files, already mounted
- Managed TLS, a public URL and custom domains
- Headless Chromium renderer kept off the public internet
Common Use Cases
- Infrastructure and application dashboards over Prometheus, Loki and ClickHouse
- Business metrics read straight from a production PostgreSQL or MySQL replica
- On-call alerting, evaluated in Grafana and routed to Slack or PagerDuty
- Status dashboards shared as snapshots or PNG reports
Dependencies for Grafana
- Grafana (
grafana/grafana:latest) — the OSS build from github.com/grafana/grafana.grafana/grafana-osscarries the same builds but itslatesttag lags behind. - PostgreSQL (Railway managed) — Grafana's configuration database
- Redis (Railway managed) — remote cache for query results and tokens
- image-renderer (
grafana/grafana-image-renderer:latest) — headless Chromium from github.com/grafana/grafana-image-renderer, private, port 8081
Environment Variables Reference
| Variable | Description | Required |
|---|---|---|
GF_SECURITY_ADMIN_PASSWORD | Password for the built-in admin user | Yes |
GF_SECURITY_SECRET_KEY | Encrypts stored data source credentials | Yes |
GF_DATABASE_* | Postgres host, name, user, password | Yes |
GF_SERVER_ROOT_URL | Public URL used in links and renders | Yes |
GF_REMOTE_CACHE_CONNSTR | Redis address, password, db index | Recommended |
GF_RENDERING_SERVER_URL | Private renderer /render endpoint | Recommended |
GF_RENDERING_RENDERER_TOKEN | Must match the renderer's AUTH_TOKEN | Recommended |
GF_SECURITY_CONTENT_SECURITY_POLICY_TEMPLATE | CSP; must allow blob: | Recommended |
Deployment Dependencies
- Docs: · Rendering:
- Images:
grafana/grafana,grafana/grafana-image-rendereron Docker Hub
Hardware Requirements for Self-Hosting Grafana
Grafana is light; the renderer needs headroom — every render starts a Chromium page.
| Resource | Minimum | Recommended |
|---|---|---|
| CPU | 1 vCPU | 2 vCPU each |
| RAM | 512 MB Grafana, 1 GB renderer | 2 GB Grafana, 4 GB renderer |
| Volume | 1 GB | 5 GB+ with many plugins |
| PostgreSQL | 1 GB | 2 GB+ |
Keep Grafana at one replica. HA Grafana needs an explicit gossip peer list for unified alerting; without one, a second replica evaluates every rule and double-sends notifications. Scale the renderer instead if export queues up.
How to Self-Host Grafana with Docker
One container with a volume is enough to try locally, on port 3000:
docker run -d --name grafana -p 3000:3000 \
  -v grafana-storage:/var/lib/grafana \
  -e GF_SECURITY_ADMIN_PASSWORD="change-me" \
  grafana/grafana:latest
For anything shared, move state into PostgreSQL and add the renderer alongside it. The variables that matter:
GF_DATABASE_TYPE="postgres"
GF_DATABASE_HOST="postgres:5432"
GF_DATABASE_NAME="grafana"
GF_DATABASE_USER="grafana"
GF_DATABASE_PASSWORD="grafana"
GF_SECURITY_SECRET_KEY="a-long-random-string"
GF_REMOTE_CACHE_TYPE="redis"
GF_REMOTE_CACHE_CONNSTR="addr=redis:6379,password=,db=0,ssl=false"
GF_RENDERING_SERVER_URL="http://renderer:8081/render"
GF_RENDERING_CALLBACK_URL="http://grafana:3000/"
GF_RENDERING_RENDERER_TOKEN="a-shared-token"
Back up GF_SECURITY_SECRET_KEY: it encrypts every stored data source password, so restoring a dump under a different key leaves those data sources unable to connect. Two things catch people out — the renderer needs that same token in its own AUTH_TOKEN, and enabling the content security policy blocks image export unless the policy template allows blob:. The stock one does not, and the failure is silent apart from a console message.
Is Grafana Free to Self-Host?
Grafana OSS is free and open source under AGPLv3, with no cap on users, dashboards or data sources — everything here is included. Grafana Enterprise adds reporting, RBAC and support under a paid licence. Grafana Cloud is the hosted option: free for 3 users, 10k metric series and 50 GB of logs, then Pro at $19/month plus usage. Self-hosting costs infrastructure only.
FAQ
What is Grafana? An open source platform for querying, visualising and alerting on metrics, logs and traces. It connects to data sources you already run rather than storing telemetry itself.
What does this Railway template deploy? Four services: Grafana on a public URL with a volume, managed PostgreSQL, managed Redis, and a private image-renderer for PNG export.
Why does the template include PostgreSQL and Redis? Grafana defaults to a SQLite file, tying all state to one container's disk. PostgreSQL holds dashboards, users, sessions and encrypted credentials instead, so redeploys are safe. Redis is the remote cache.
What are the default Grafana login credentials?
Username admin, password whatever you set in GF_SECURITY_ADMIN_PASSWORD. Grafana's stock admin / admin no longer applies once that is set.
How do I connect Grafana to a database on Railway?
Use the target service's private hostname, such as postgres.railway.internal:5432. Give Grafana a read-only role on anything it queries — data source SQL runs verbatim, so SELECT-only is right.
Why is my dashboard image export blank in self-hosted Grafana?
Usually the content security policy: the default template omits blob: from img-src, so the browser blocks a preview the renderer produced fine. This template ships a corrected policy.
Can I run multiple Grafana replicas for high availability? Not usefully. Alerting HA needs each instance to know its peers by address, and replicas share one hostname, so duplicates follow.
Template Content
Redis
redis:8.2image-renderer
grafana/grafana-image-renderer:latestGrafana
grafana/grafana:latestGF_SECURITY_ADMIN_PASSWORD
Set this — your admin password