
Deploy Jaeger
See where a request spent its time across all your services
jaeger-index-cleaner
Just deployed
jaeger-query
Just deployed
jaeger-collector
Just deployed

gateway
Just deployed

opensearch
Just deployed
/usr/share/opensearch/data
jaeger-snapshots
Bucket
Just deployed
Deploy and Host Jaeger on Railway
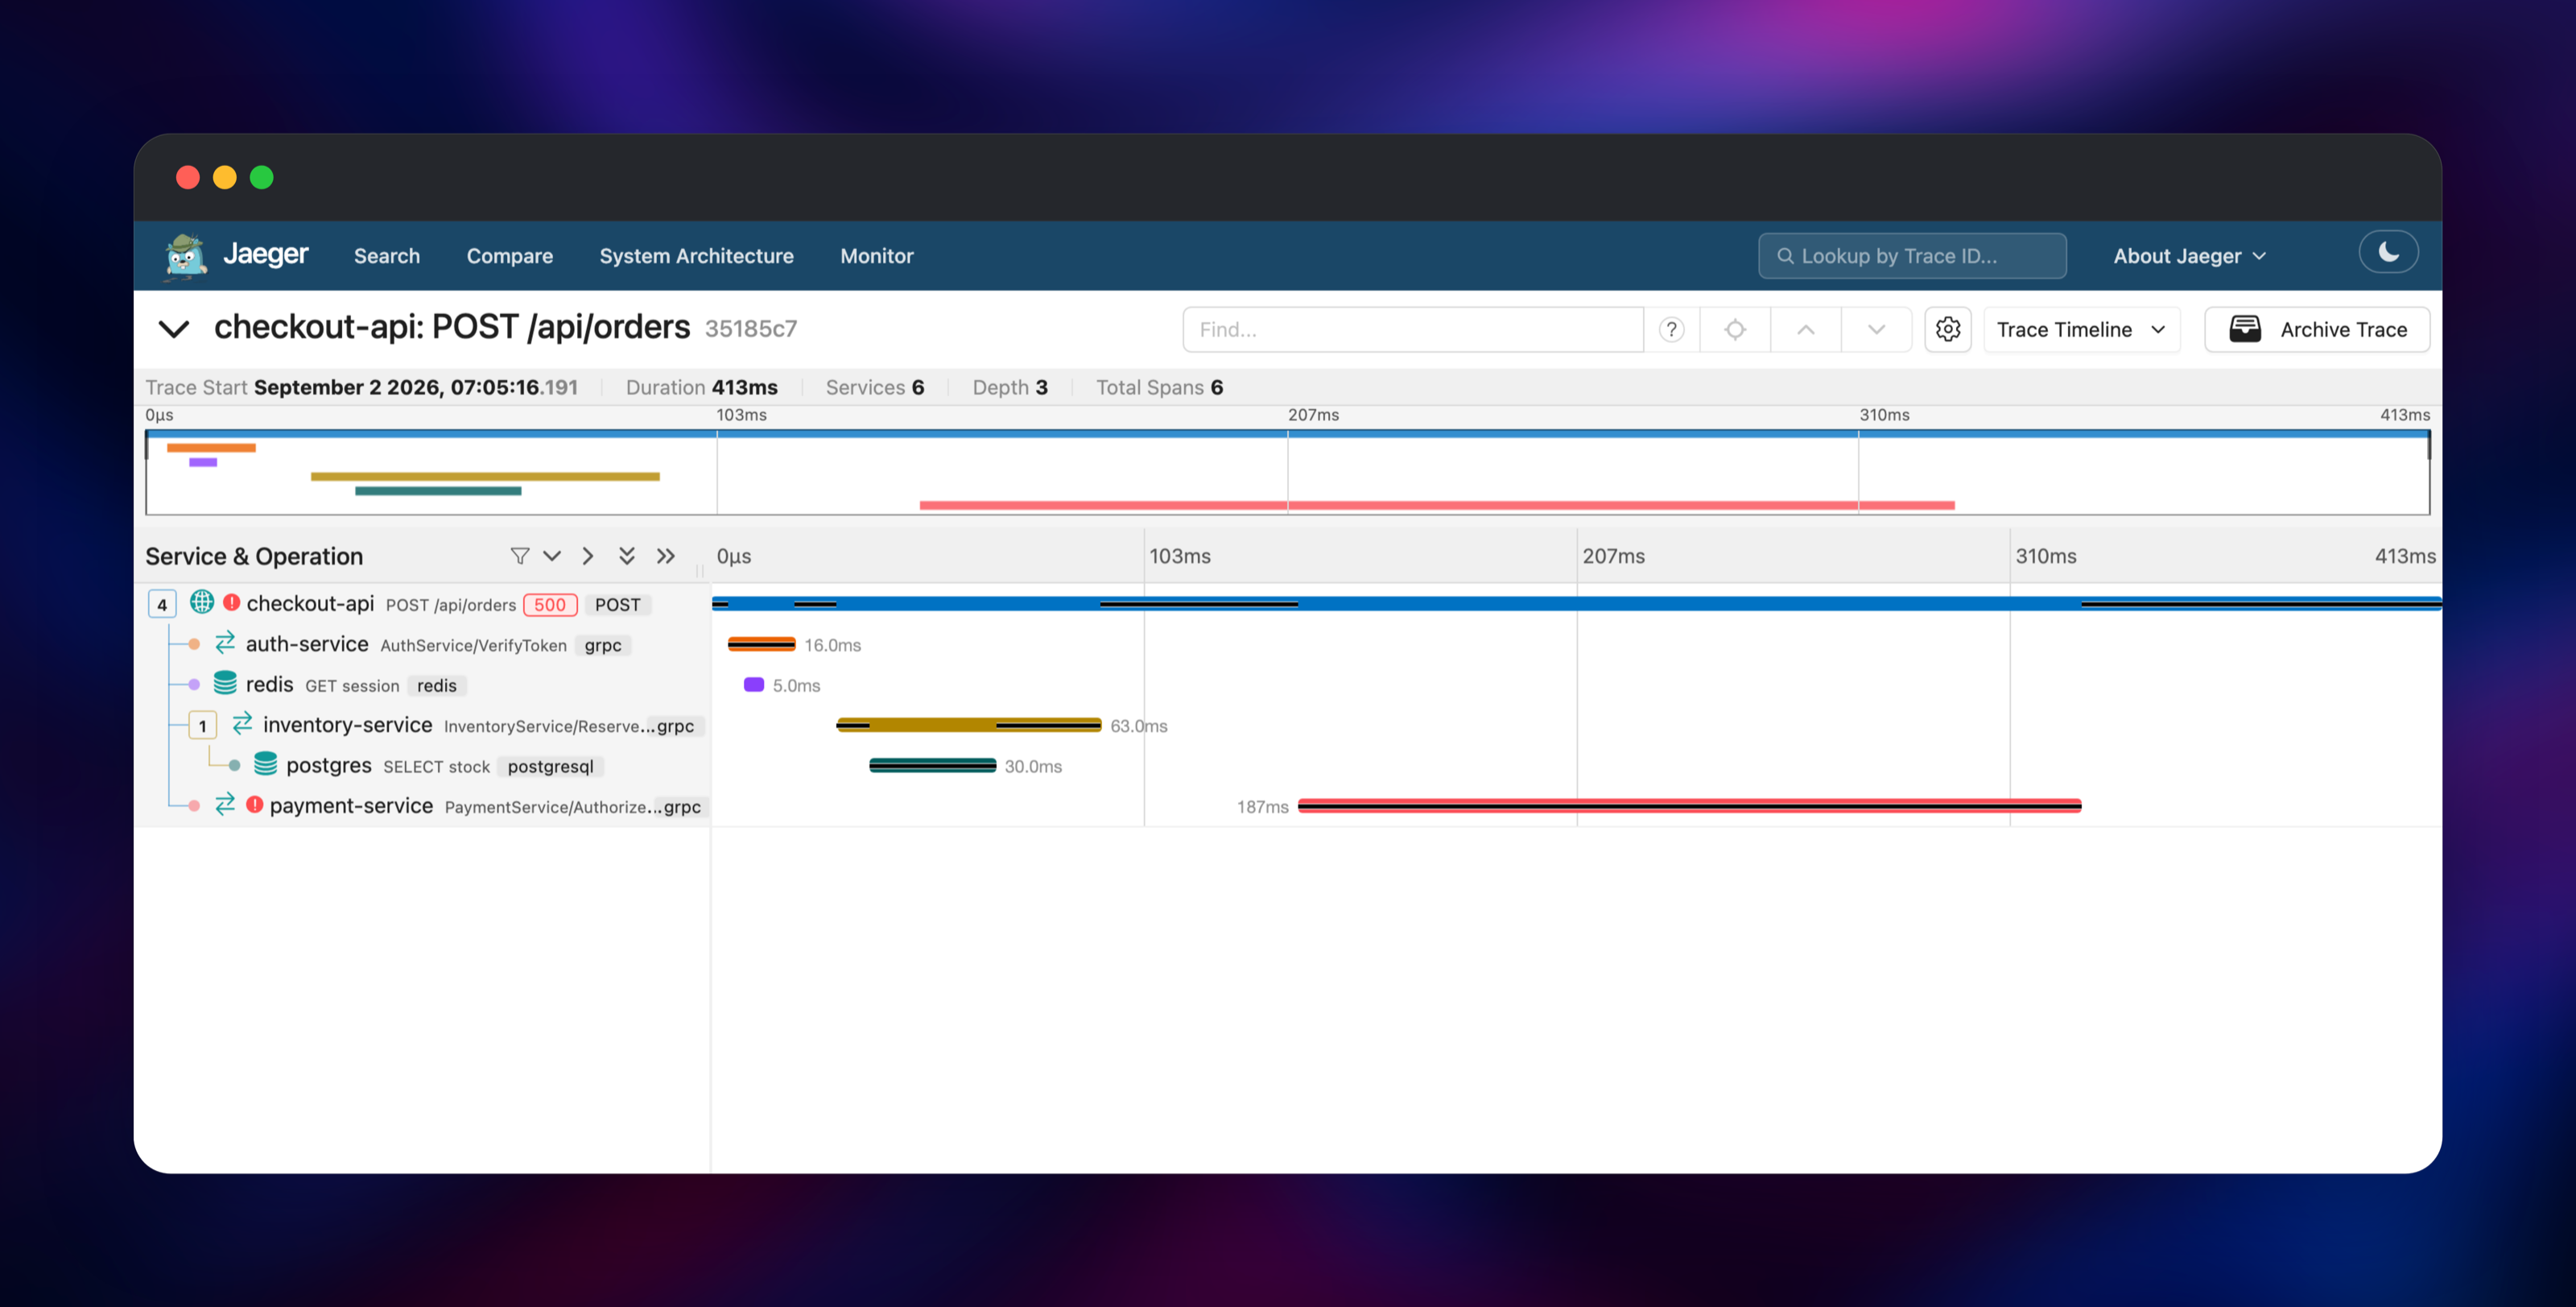
Jaeger is the CNCF-graduated distributed tracing platform that answers what a dashboard cannot: where did this request actually spend its time? Instrumented services emit OpenTelemetry spans, Jaeger stitches them into one trace, and the UI draws it as a timeline of every hop — the API gateway, the gRPC calls it fanned out, the database query underneath, and the span that returned the error.
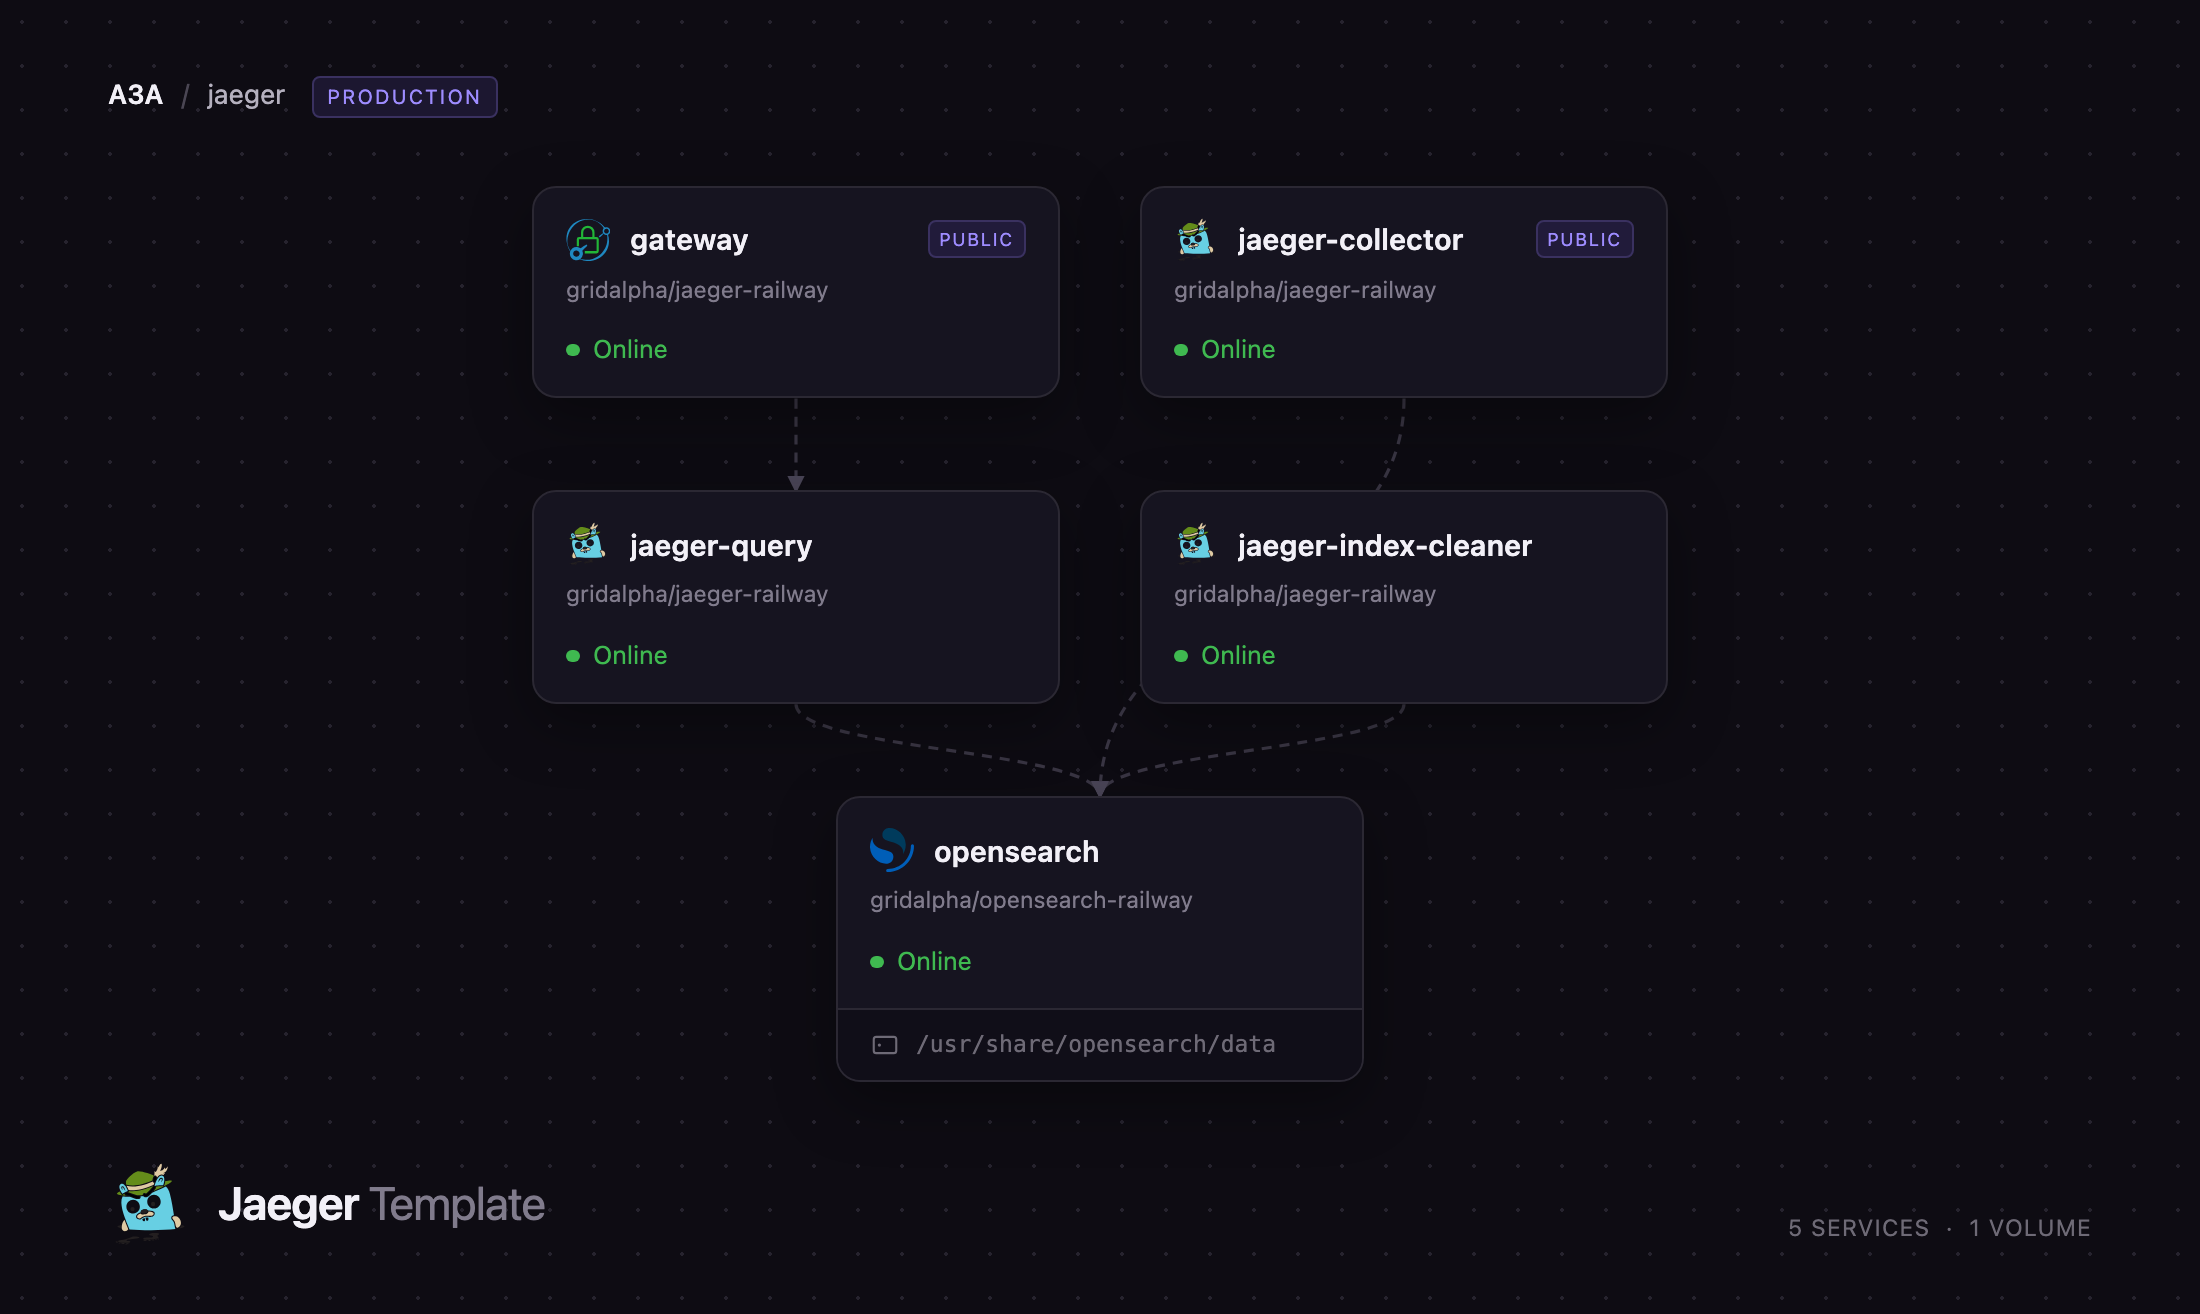
Self-host Jaeger on Railway with a real production topology rather than the single-container demo. This template deploys Jaeger v2 split into its two documented roles — a collector that receives spans and a query service serving the UI and API — backed by a persistent OpenSearch index, fronted by a Caddy gateway supplying the HTTP basic authentication the UI ships without, and paired with an index cleaner that enforces a retention window. Applications send OTLP to the collector's authenticated endpoint; you read the results through the gateway.
Getting Started with Jaeger on Railway
After deploying, open the gateway service's public URL. The browser prompts for HTTP basic credentials: the username is admin and the password is the generated JAEGER_UI_PASSWORD on the gateway service, copied from its Variables tab. Behind the prompt is the Jaeger UI, empty until something sends it spans, so the first useful action is pointing an application at the collector. Take the jaeger-collector service's public domain and its OTLP_USERNAME / OTLP_PASSWORD pair, then configure any OpenTelemetry SDK or Collector to export there. These variables are all a typical instrumented app needs:
OTEL_EXPORTER_OTLP_ENDPOINT=https://your-collector.up.railway.app
OTEL_EXPORTER_OTLP_PROTOCOL=http/protobuf
OTEL_EXPORTER_OTLP_HEADERS=Authorization=Basic
OTEL_SERVICE_NAME=checkout-api
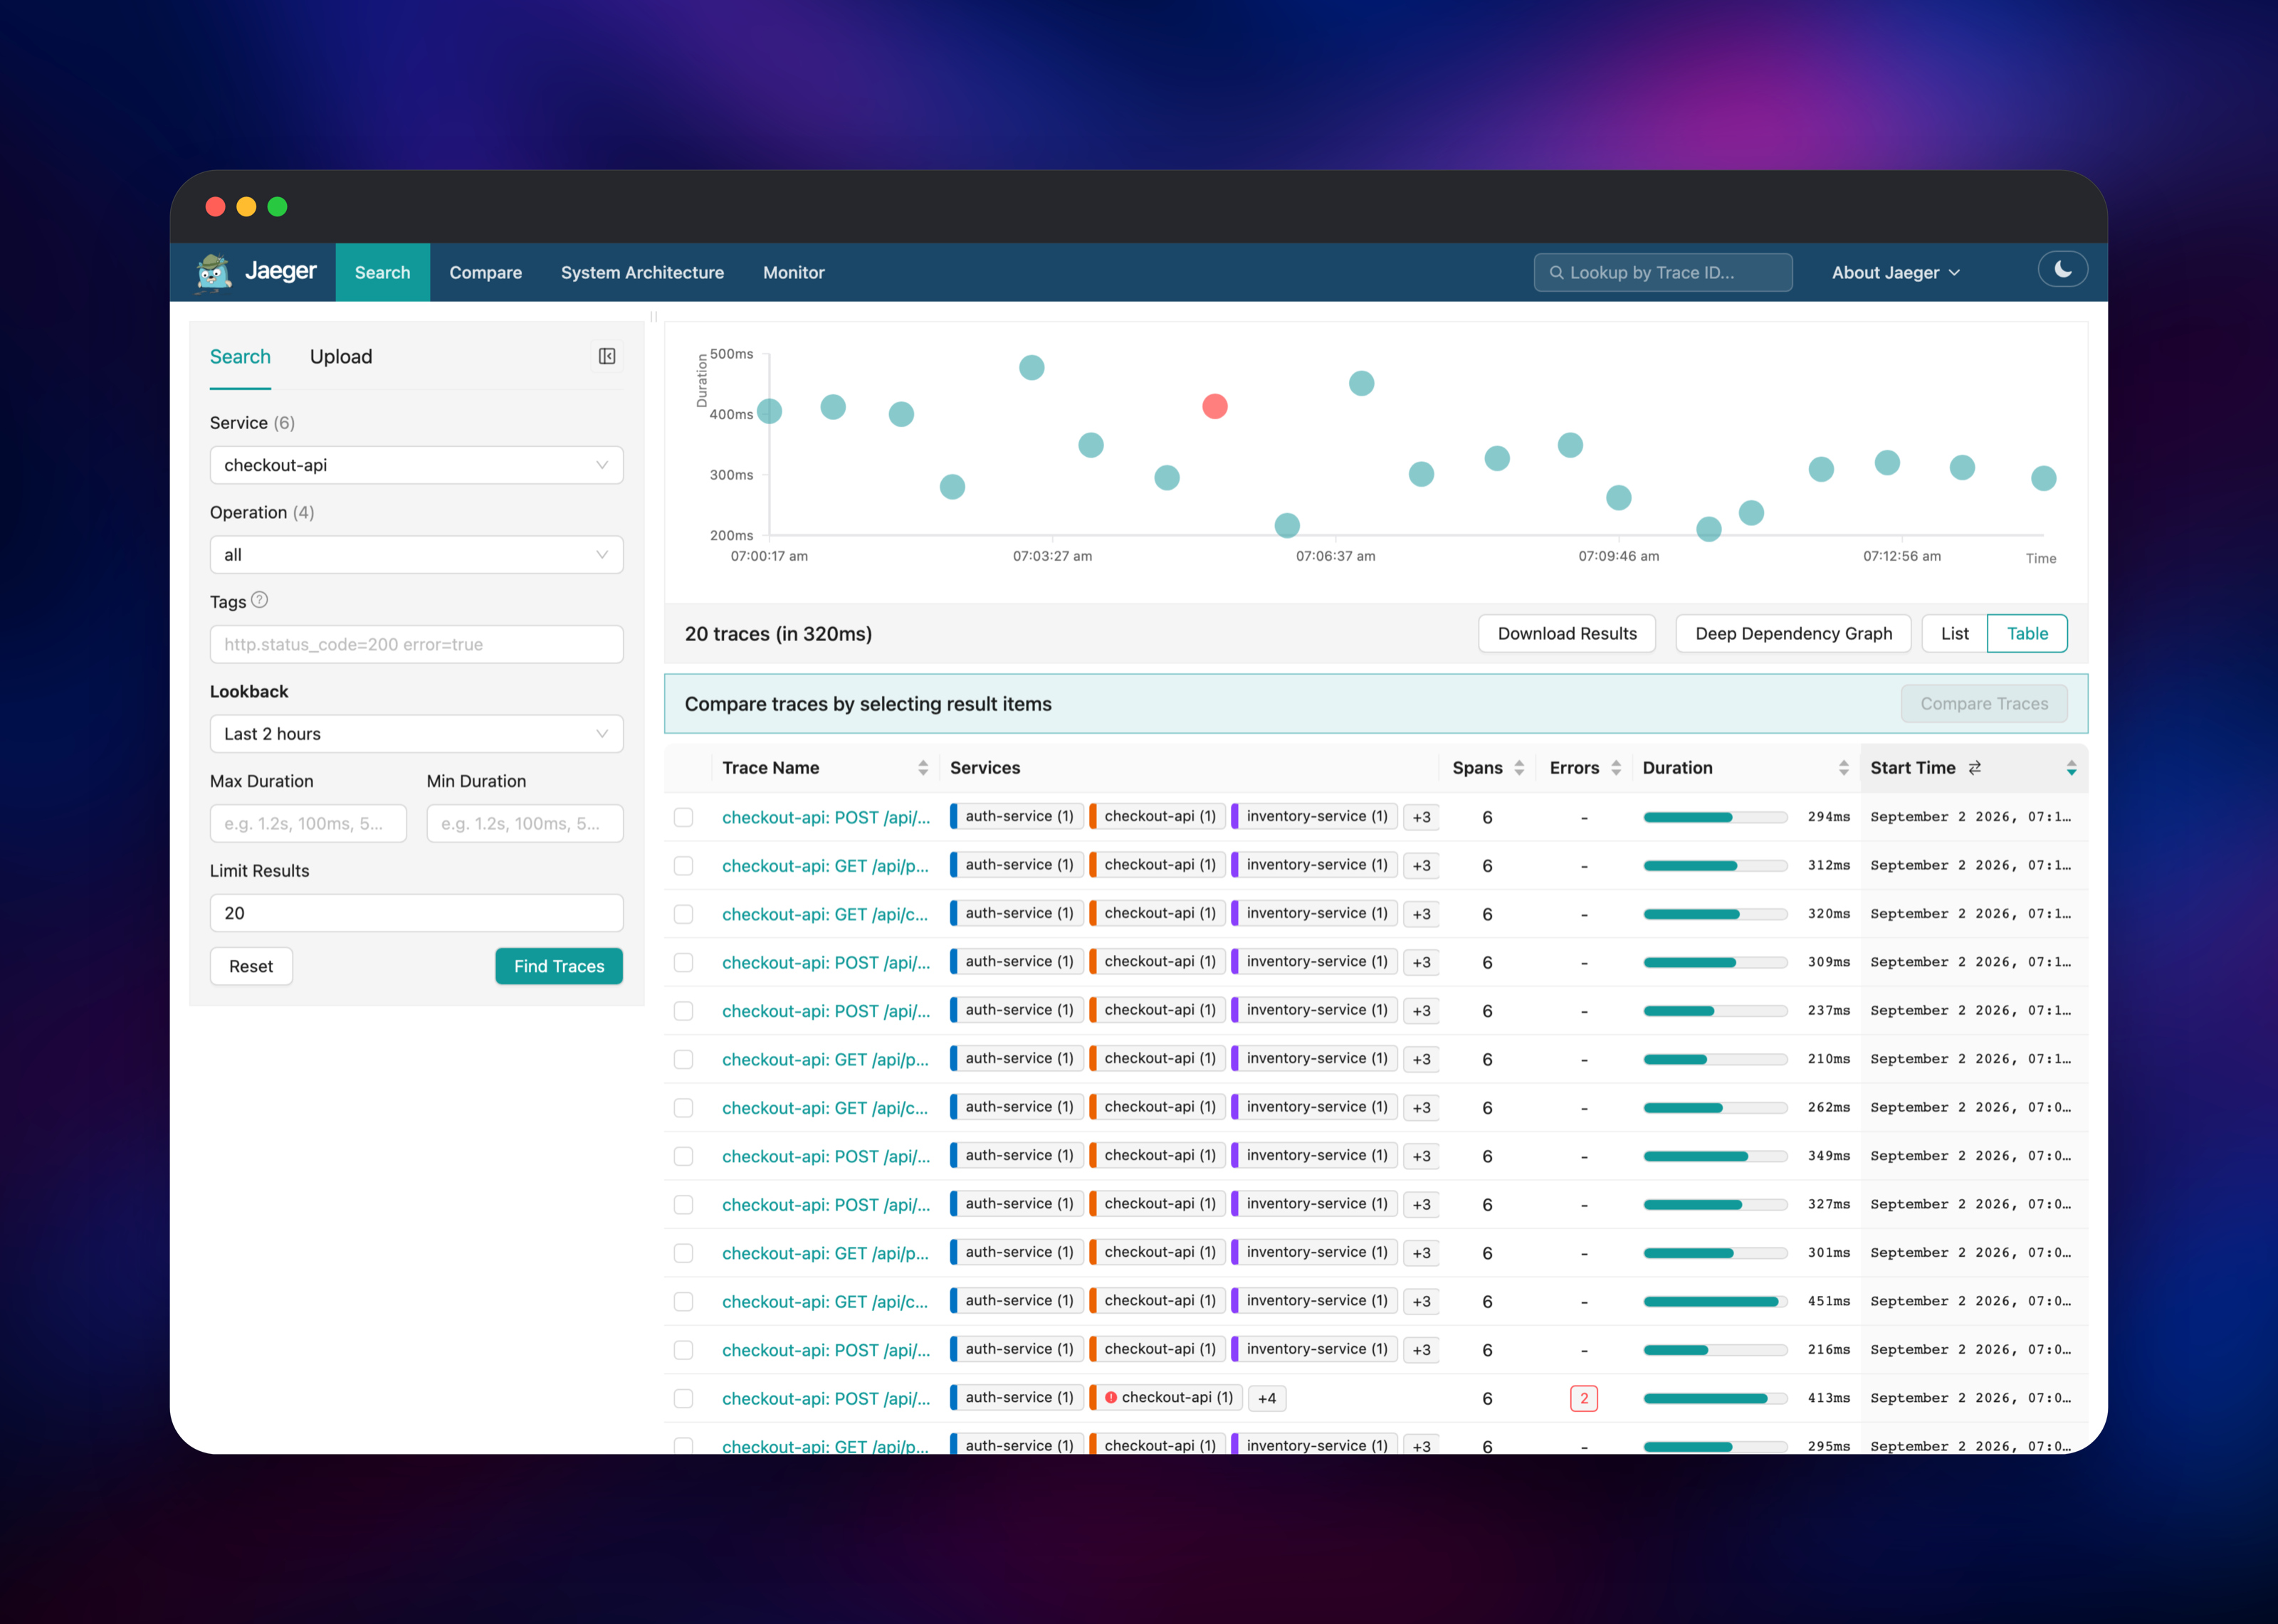
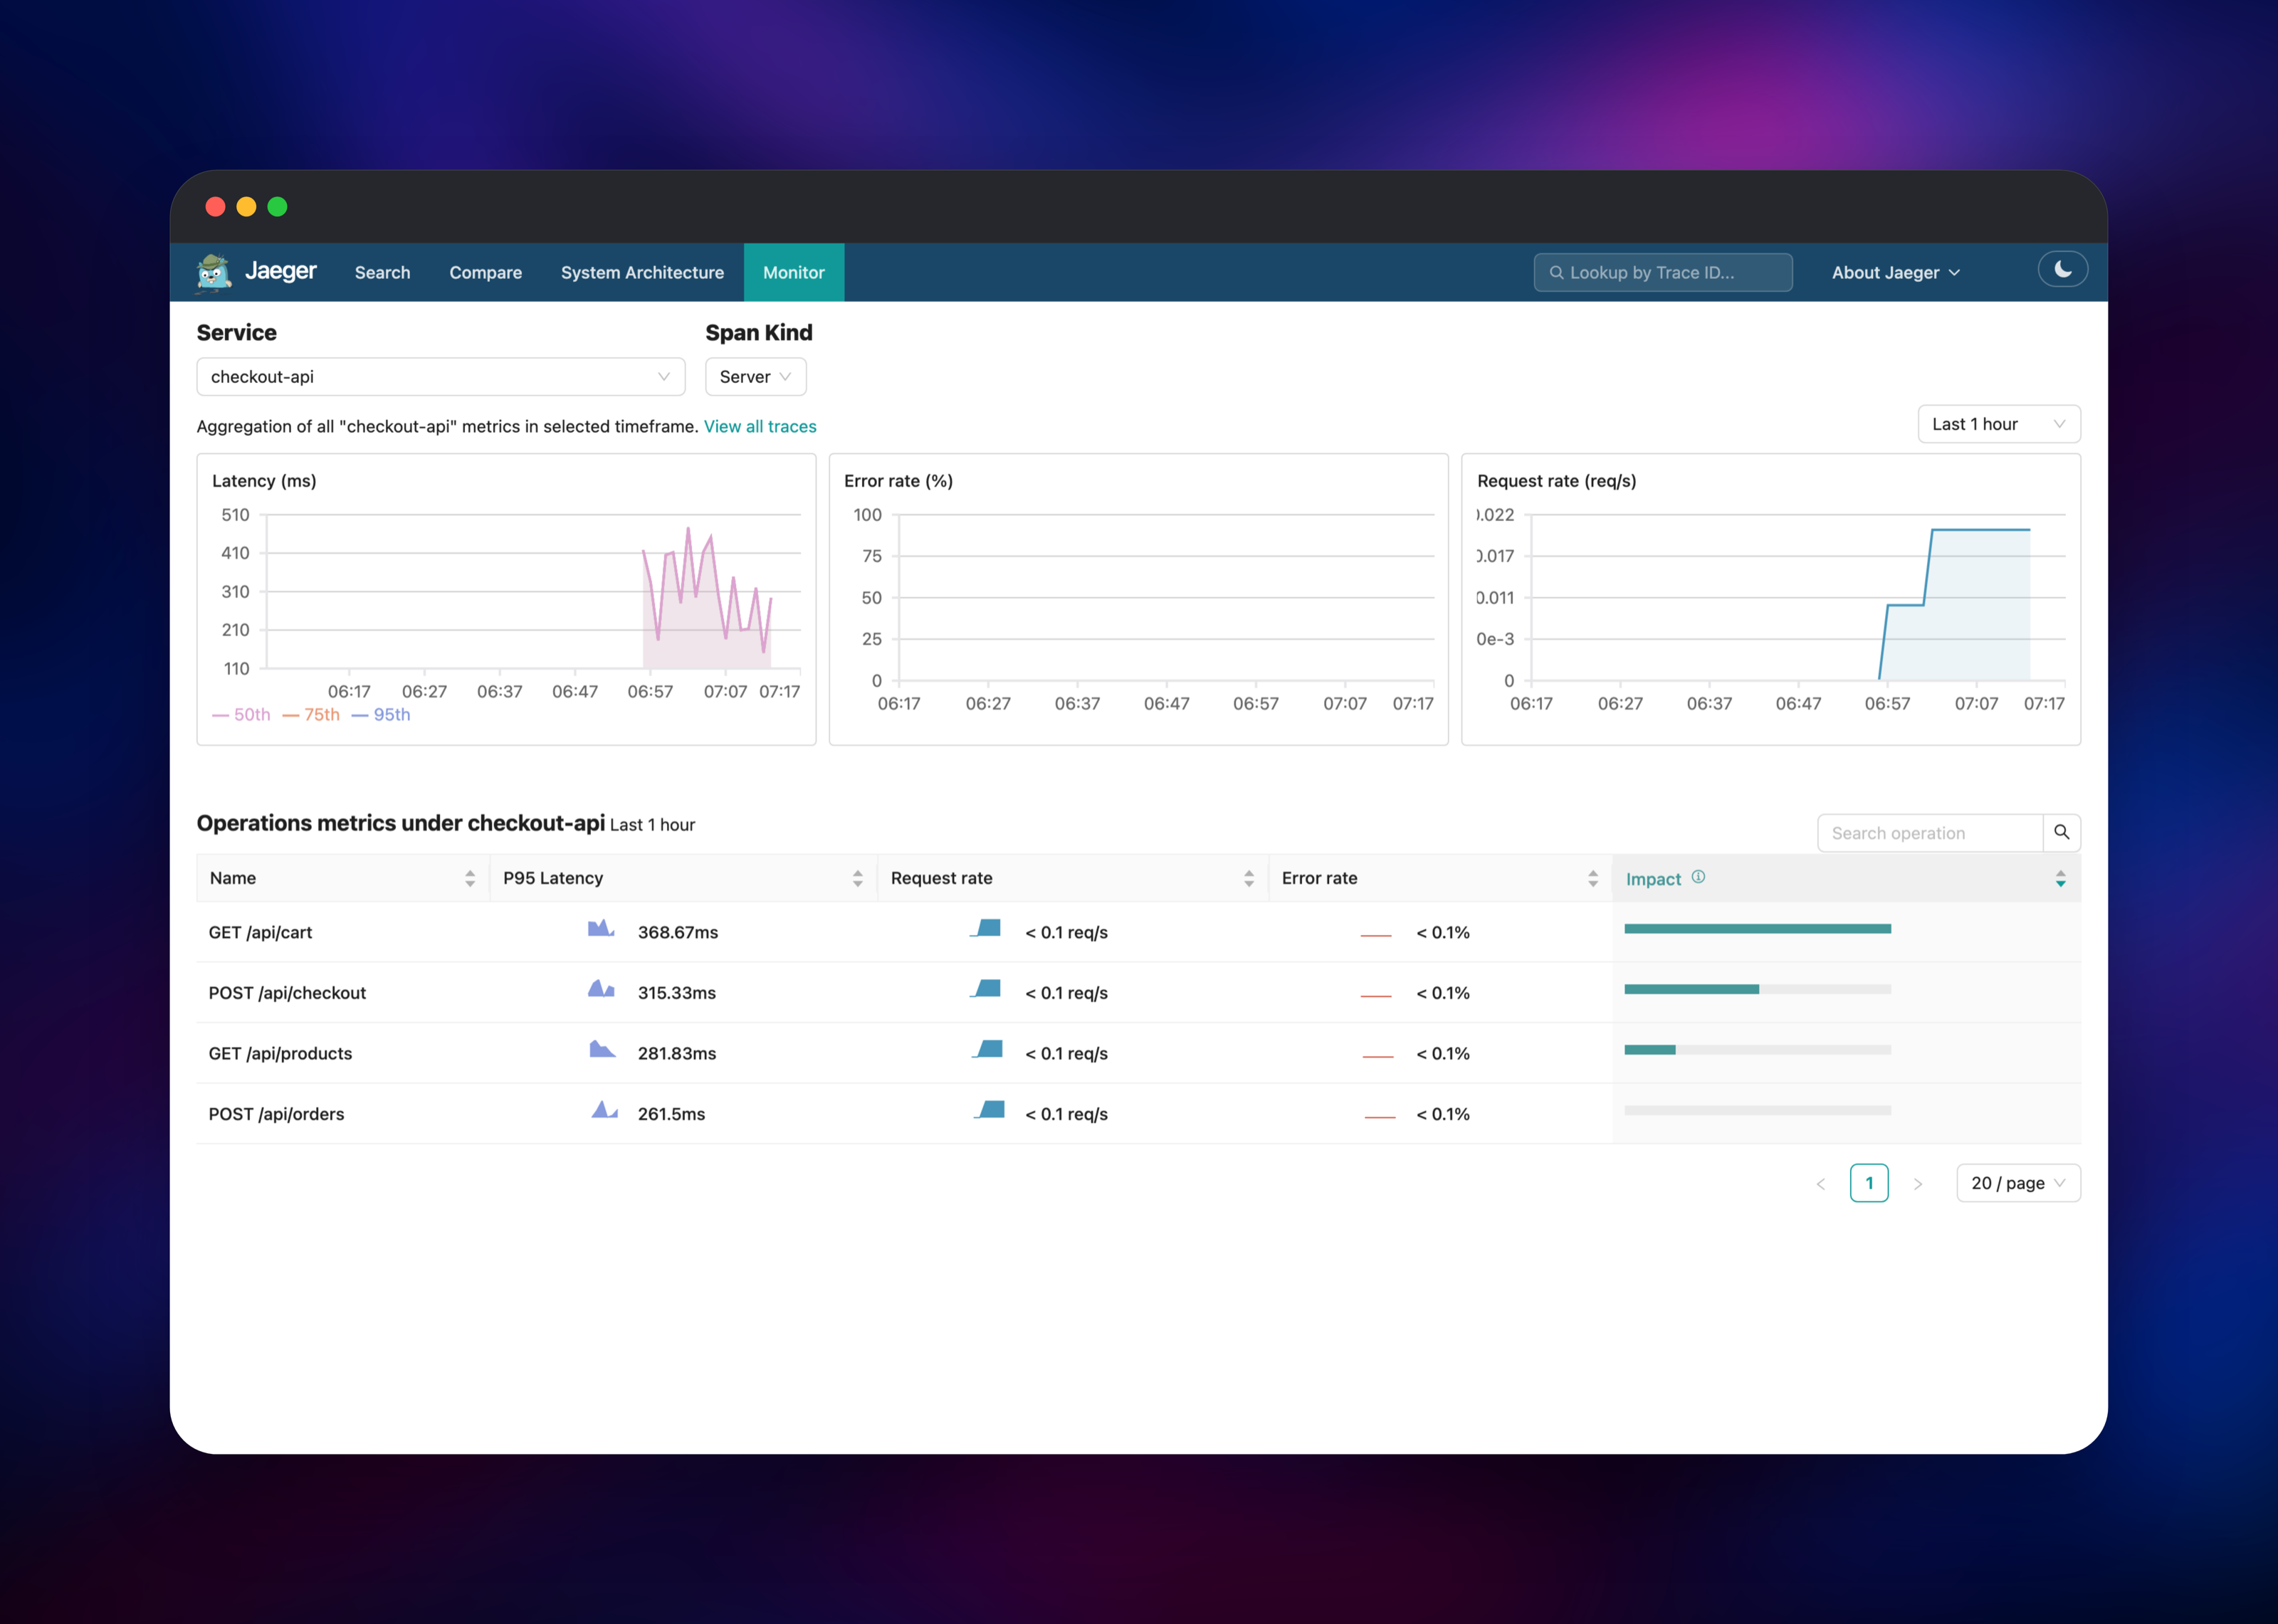
Send a request through your app, return to the UI, pick your service in the Search sidebar and click Find Traces. A result opens the timeline view; the Monitor tab charts latency percentiles and request rates from the same data. The collector also has a TCP proxy on port 4317 for OTLP/gRPC, taking the same credentials.
About Hosting Jaeger
Jaeger solves the problem logs and metrics leave open: a slow or broken request crosses several services and no one service's telemetry explains it. A trace carries one identifier across every hop, so the timeline shows which call was slow, which failed, and what ran underneath. Teams self-host it to keep telemetry in-house, or because per-span SaaS pricing stops making sense at volume.
Key capabilities:
- Trace search and timeline view — filter by service, operation, tag, duration or error, then read the waterfall
- Service Performance Monitoring — latency percentiles and request and error rates per operation, derived from the spans
- Trace comparison — diff two traces structurally to see what changed
- OpenTelemetry-native ingest — OTLP over gRPC and HTTP
- Remote sampling and trace archiving — clients fetch their sampling rate from the collector; pinned traces outlive retention
The architecture separates the write path from the read path. jaeger-collector terminates OTLP, batches spans and writes them into OpenSearch; it is the only service your applications reach. jaeger-query reads the same indices to serve the UI and query API, and stays on the private network. opensearch is the trace store — a single node with a persistent volume and daily snapshots to a Railway object storage bucket. gateway supplies the authentication Jaeger lacks, and jaeger-index-cleaner deletes rotated span indices past the retention window.
Why Deploy Jaeger on Railway
Railway removes the infrastructure work a self-hosted tracing backend usually implies:
- The storage tier, both Jaeger roles and the gateway deploy in one click
- Private networking keeps OpenSearch and the query service off the internet
- A persistent volume and managed object storage give traces durability
- Scaling is a slider, not a cluster rebuild
- HTTPS endpoints and a TCP proxy for OTLP/gRPC are provisioned for you
Common Use Cases
- Debugging latency in a microservice architecture — find the downstream call behind a slow checkout instead of guessing from dashboards
- Root-causing production errors — jump from an error span to the query, retry or timeout that caused it
- Validating a refactor — compare traces before and after to confirm the call graph changed as intended
- Giving an OpenTelemetry rollout a home — a backend your SDKs point at on day one
Dependencies for Jaeger
jaegertracing/jaeger:2.20.0— the Jaeger v2 binary, deployed twice: as the collector and as the query serviceopensearchproject/opensearch:3— the trace store, one of the two backends Jaeger recommends for productioncaddy:2-alpine— the authenticating reverse proxy in front of the UIalpine— the retention worker, plus a Railway object storage bucket for snapshots- Source repositories: gridalpha/jaeger-railway and gridalpha/opensearch-railway
Environment Variables Reference
| Variable | Service | Purpose |
|---|---|---|
OTLP_USERNAME / OTLP_PASSWORD | jaeger-collector | Credentials applications send with every span batch |
JAEGER_UI_USERNAME / JAEGER_UI_PASSWORD | gateway | Browser sign-in for the Jaeger UI |
OPENSEARCH_URL | collector, query, cleaner | Private address of the trace store |
RETENTION_DAYS | jaeger-index-cleaner | Days of span indices kept before deletion |
Deployment Dependencies
- Runtime: Go (Jaeger and Caddy) and a JVM (OpenSearch)
- Jaeger on GitHub · Docker Hub · Documentation
Hardware Requirements for Self-Hosting Jaeger
| Resource | Minimum | Recommended |
|---|---|---|
| CPU | 2 vCPU across all services | 4+ vCPU |
| RAM | 4 GB (OpenSearch needs most of it) | 8 GB or more |
| Storage | 5 GB volume | 20 GB+, sized to trace volume × retention |
| Runtime | Linux container | Linux container |
OpenSearch dominates the footprint; the Jaeger roles and gateway are light Go processes. Storage is the number to watch — traces are kept seven days by default, so raise the volume or lower RETENTION_DAYS on the index cleaner as ingest grows.
Self-Hosting Jaeger with Docker
For a local trial, Jaeger's all-in-one image keeps traces in memory:
docker run --rm -p 16686:16686 -p 4317:4317 -p 4318:4318 \
  jaegertracing/jaeger:2.20.0
A production install replaces memory with a real backend and splits the roles. Jaeger v2 is configured by a YAML file passed with --config; each role runs the same binary:
docker run -v $PWD/collector.yaml:/etc/jaeger/config.yaml \
  jaegertracing/jaeger:2.20.0 --config /etc/jaeger/config.yaml
Verify a deployment by posting an empty OTLP payload:
curl -u "otlp:$OTLP_PASSWORD" -X POST \
  https://your-collector.up.railway.app/v1/traces \
  -H 'content-type: application/json' -d '{"resourceSpans":[]}'
How Much Does Jaeger Cost to Self-Host?
Jaeger is free and open source under Apache 2.0, with no paid tier, seat limits or per-span billing — the project is CNCF-graduated and community-governed. OpenSearch and Caddy are Apache 2.0 too. The only cost is infrastructure, usage-based on Railway across the five services and the volume. Retention is the main lever on that bill.
FAQ
What is Jaeger? Jaeger is an open-source distributed tracing system, built at Uber and now a graduated CNCF project. It collects spans from instrumented applications, assembles them into end-to-end traces, and lets you search and visualise them.
What does this Railway template deploy? Five services: a Jaeger collector for OTLP ingest, a Jaeger query service with the UI, a single-node OpenSearch trace store on a persistent volume, a Caddy gateway providing basic authentication, and a retention worker that prunes old indices.
Why does the template include OpenSearch instead of storing traces in memory? Jaeger's in-memory store loses everything on restart and cannot be searched beyond a small buffer. OpenSearch is one of the two backends Jaeger recommends for production, and it is what makes trace search, the Monitor tab and retention work.
How do I send traces to self-hosted Jaeger from my application?
Set OTEL_EXPORTER_OTLP_ENDPOINT to the collector's public URL and add an Authorization: Basic header with its credentials. Any OpenTelemetry SDK, the OpenTelemetry Collector and most service meshes export this way.
Is the Jaeger UI protected? Yes. Jaeger itself has no authentication, so this template never exposes the query service directly — a Caddy gateway with HTTP basic authentication is the only public entry point to the UI, and the OTLP endpoints require credentials of their own. Anonymous requests are rejected on both.
Template Content
jaeger-index-cleaner
gridalpha/jaeger-railwayjaeger-query
gridalpha/jaeger-railwayjaeger-collector
gridalpha/jaeger-railwaygateway
gridalpha/jaeger-railwayopensearch
gridalpha/opensearch-railwayjaeger-snapshots
Bucket