Deploy Komari
Server monitoring dashboard with agents, charts and latency checks

Just deployed
/var/lib/postgresql/data
komari
Just deployed
/app/data
Deploy and Host Komari on Railway
Komari is a lightweight, self-hosted server monitoring panel. A small Go agent runs on each machine you own — a VPS, a home server, a dedicated box — and streams CPU, memory, swap, disk, network throughput and uptime to one dashboard every few seconds. The panel draws live charts, keeps historical rollups, runs ICMP/TCP/HTTP latency checks, raises offline and load alerts, and gives you a browser terminal into any connected machine. People reach for it when Uptime Kuma only says a URL is up and Netdata is more than they want to run.
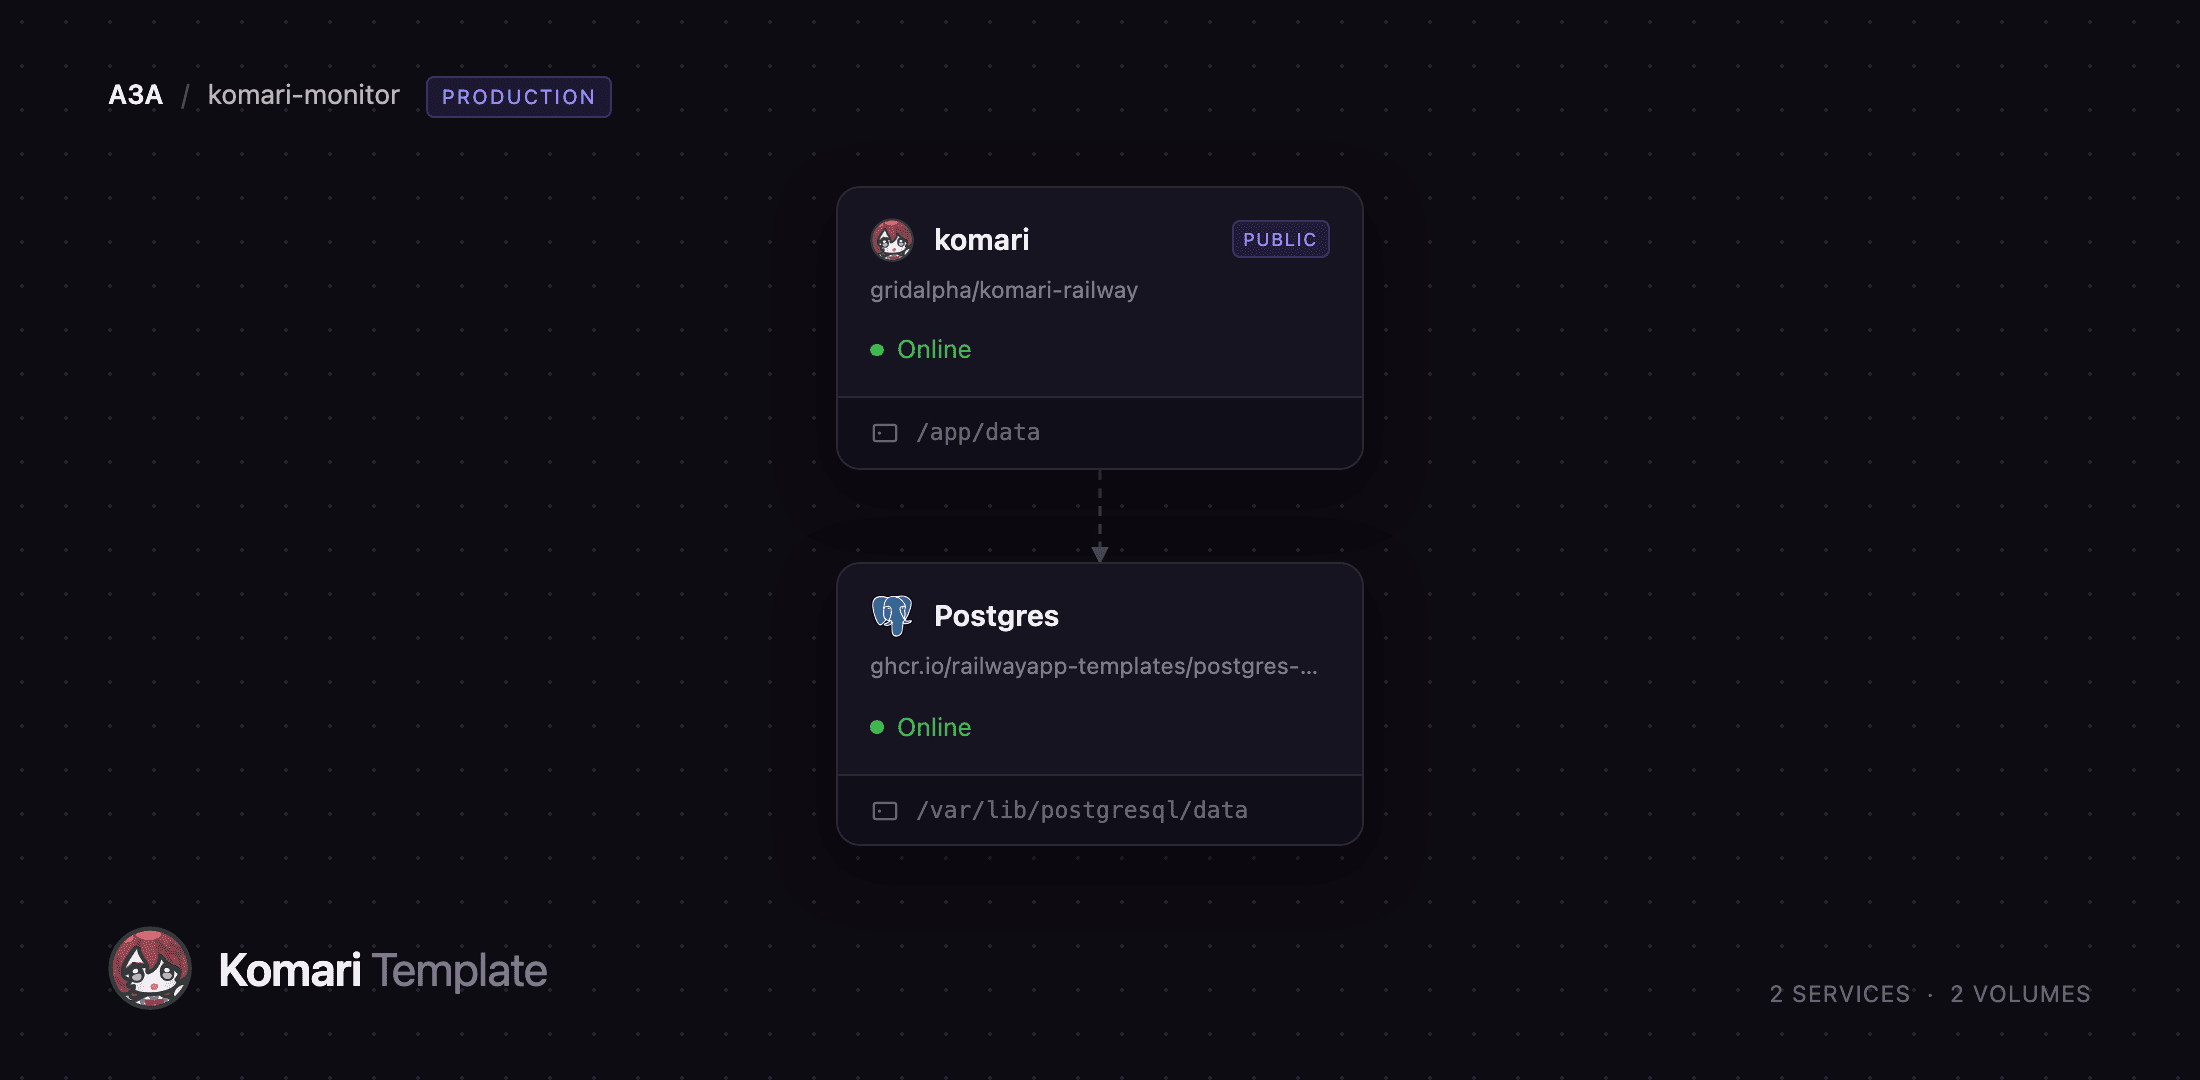
Self-host Komari on Railway and this template gives you the whole panel with no setup wizard to click through. Two services are deployed: komari, the dashboard and agent endpoint, built from a public repository that layers a first-boot entrypoint over the official image; and Postgres, Railway's managed database, used as Komari's monitoring database — the store for every metric sample and rollup. The komari service mounts a volume at /app/data for its configuration database, themes and plugins. The administrator account is created on the first boot from the variables you set, so the dashboard never shows an open installation form, and agents connect to your Railway URL over WebSocket.
Getting Started with Komari on Railway
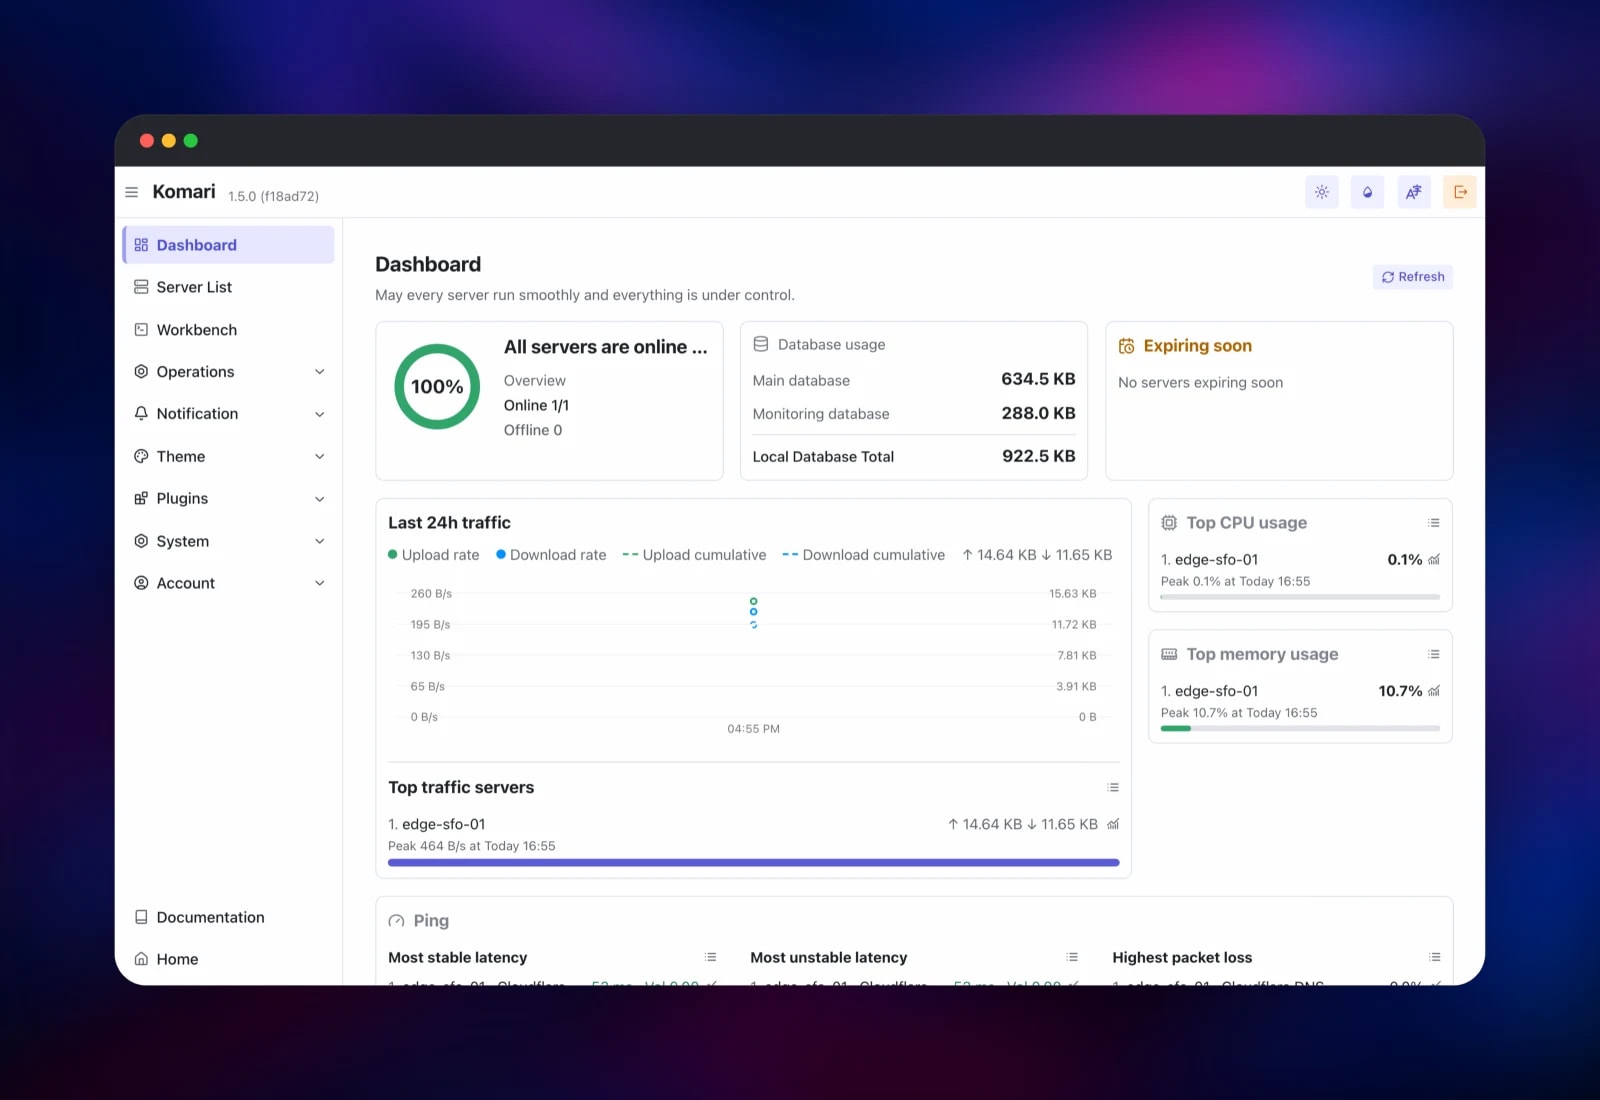
Open the generated Railway URL and you land on the public status page, empty until the first machine reports in. Click Login and sign in with the username and password you set in KOMARI_ADMIN_USERNAME and KOMARI_ADMIN_PASSWORD before deploying — that account already exists, so there is nothing to register. From the admin dashboard, go to Server List, press Add and name your first node. Expand the new row to copy its install command, then run it on the machine you want to monitor:
curl -fsSL https://raw.githubusercontent.com/komari-monitor/komari-agent/main/install.sh | bash -s -- -e https://your-app.up.railway.app -t YOUR_NODE_TOKEN
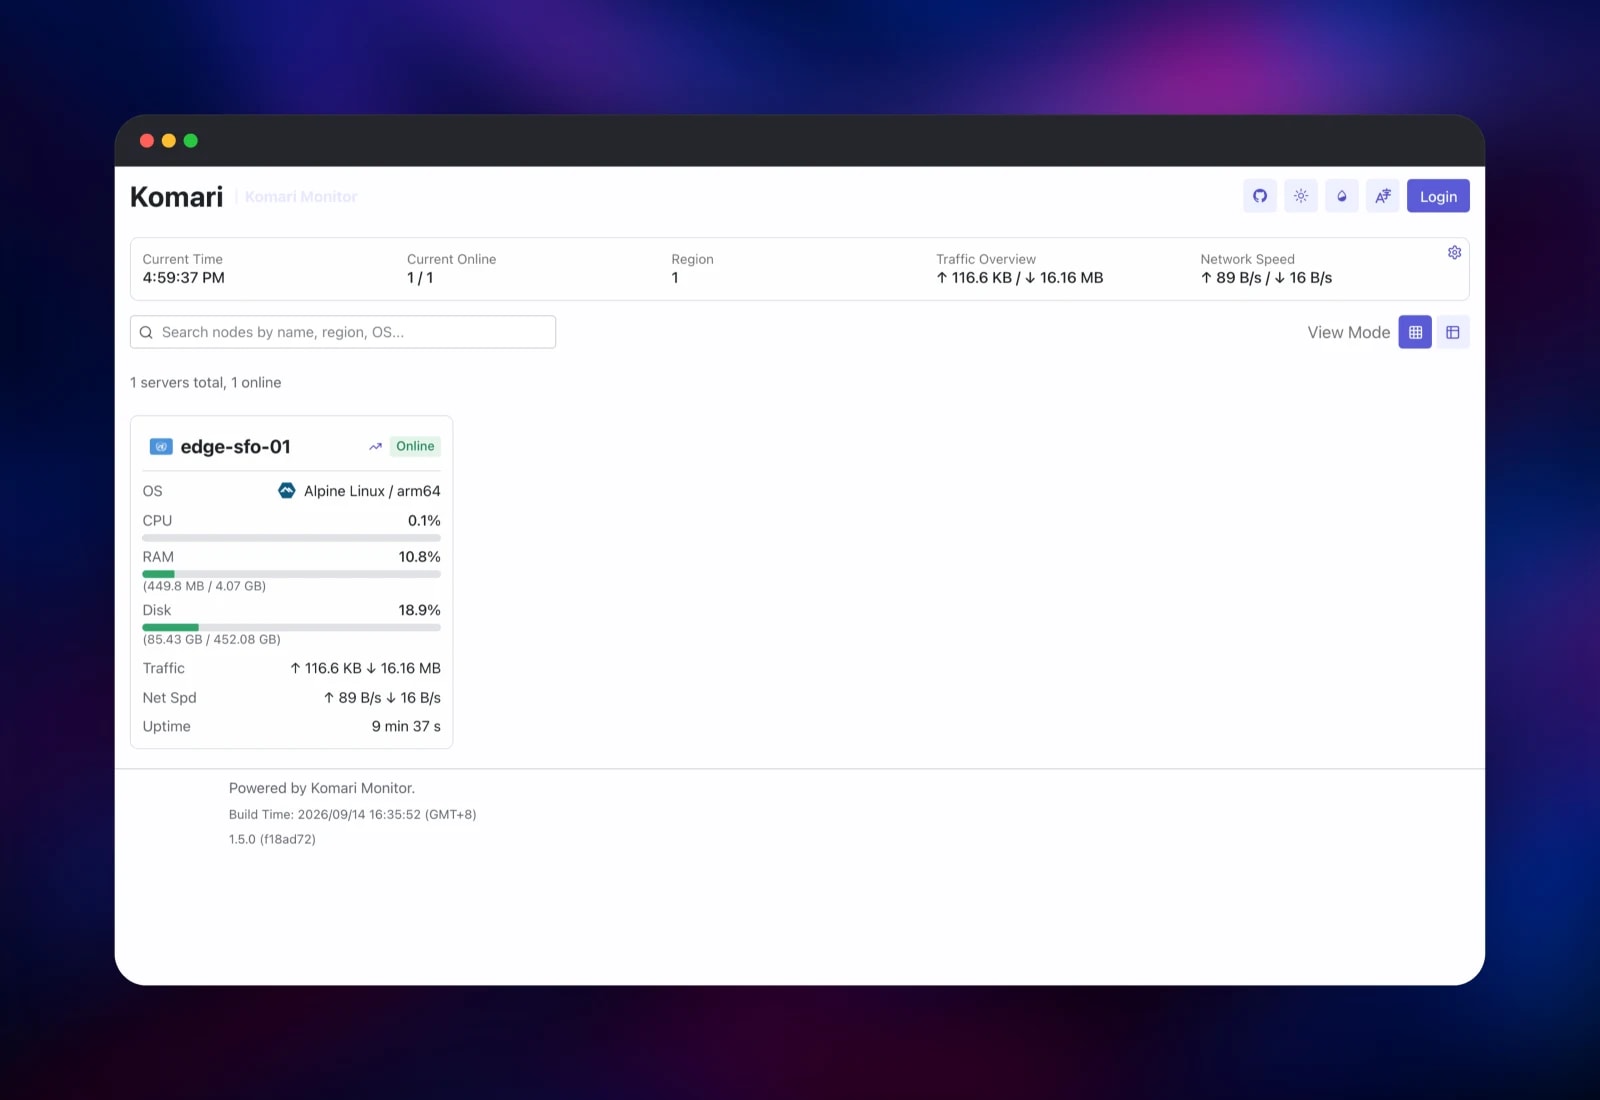
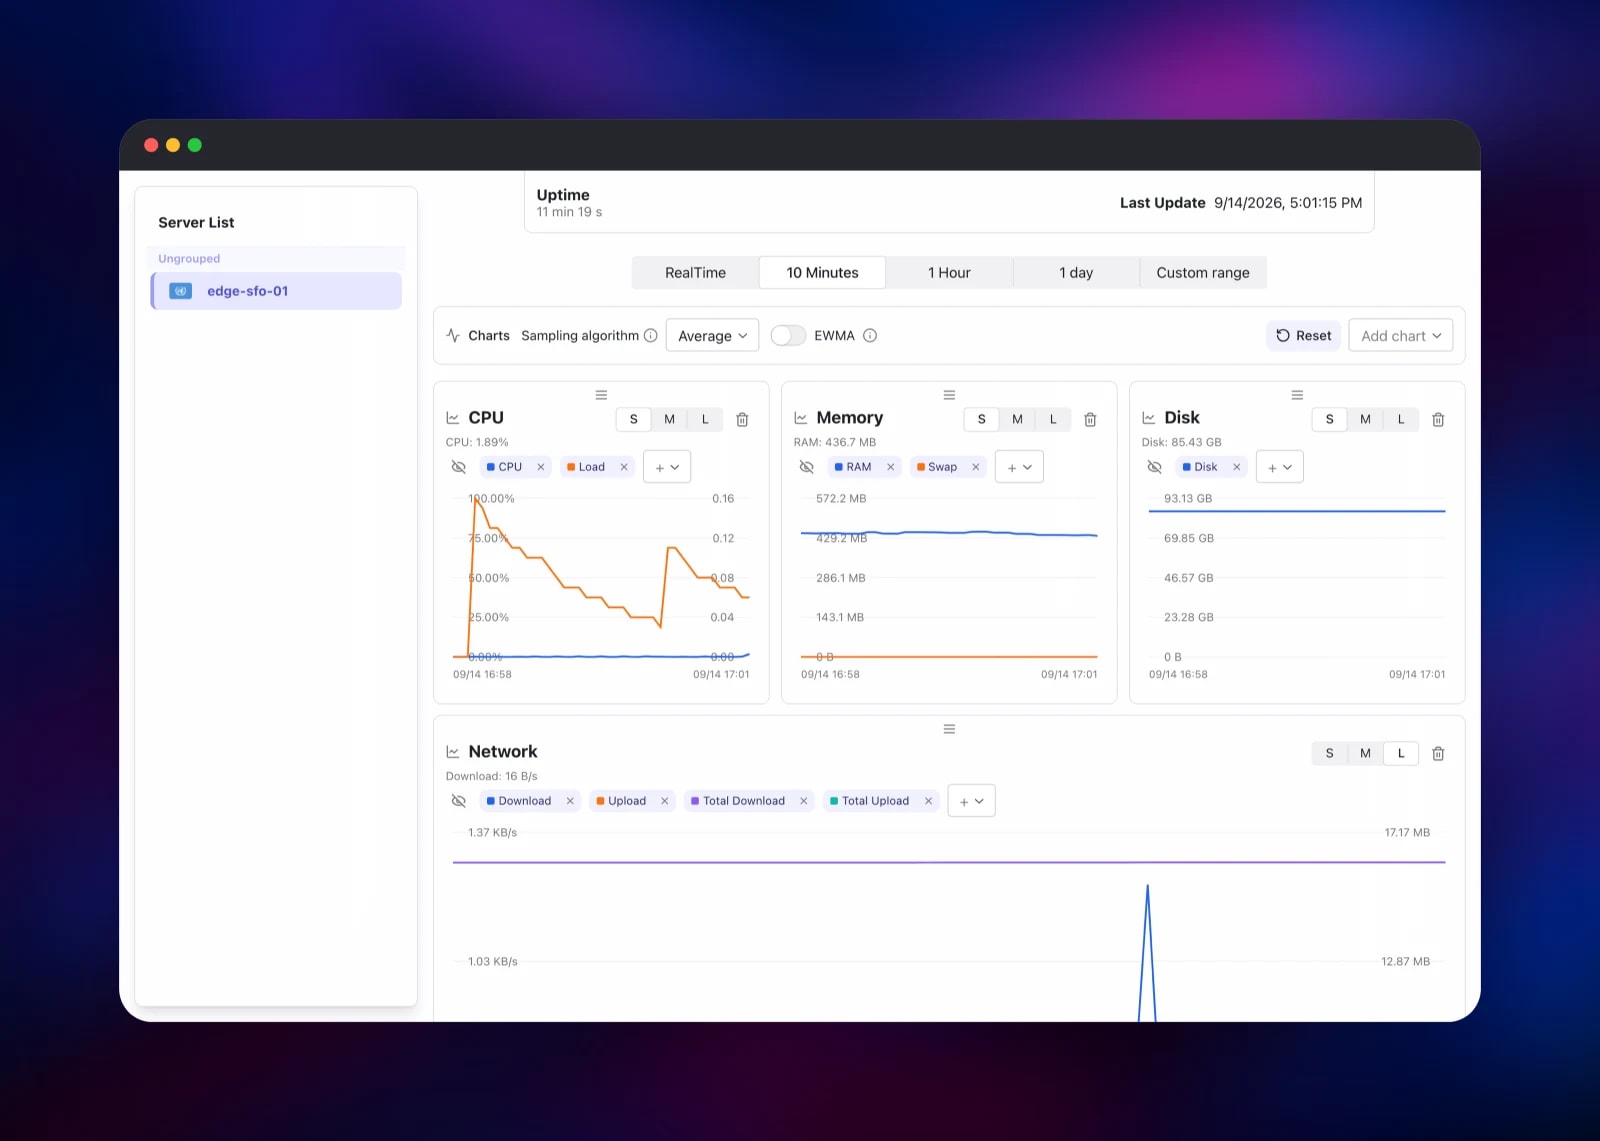
Within seconds the node flips to Online and its card fills with live CPU, memory, disk and traffic figures — the quickest confirmation the deployment works end to end. Click the node for its detail page, where the RealTime, 10 Minutes, 1 Hour and 1 day ranges come from the Postgres monitoring database. Then add a latency task under Operations → Latency — an ICMP check against 1.1.1.1 every 60 seconds, say — and bind it to the node. Turn the site private under System → Site if the status page should not be public.
About Hosting Komari
Komari answers a narrow question well: what are my servers doing right now, and what were they doing an hour ago? It is a single Go binary plus a static frontend, and the agent is a few megabytes with no dependencies. Teams self-host it because the alternative charges per host and keeps an inventory of your infrastructure on someone else's account.
Key features:
- Live metrics at seconds resolution: CPU, load, memory, swap, disk, network speed and total traffic
- Historical charts with automatic rollups, per-node traffic accounting and expiry reminders
- ICMP, TCP and HTTP latency tasks with packet-loss tracking
- Offline, load-threshold and traffic-limit notifications
- A browser terminal and file manager for connected machines
- A status page you can leave open or lock down, with themes and a plugin system
The deployment splits storage the way Komari allows. The komari service keeps configuration — accounts, nodes, tasks, settings — in SQLite on the volume, the only backend it supports for that. Its monitoring database is separate and pluggable, and points at the managed Postgres service, where the high-frequency samples land.
Why Deploy Komari on Railway
Railway removes the parts of self-hosting that are not monitoring.
- The administrator account is created on first boot, so no installation form is ever public
- Managed Postgres for metric history, with backups, instead of a growing file on a box
- A volume for the configuration database, so redeploys keep nodes and settings
- HTTPS and a hostname agents can reach immediately, with no reverse proxy to configure
- Vertical scaling and deploy logs without touching a server
Common Use Cases
- Watching VPS instances spread across several providers from one status page
- Publishing a public uptime and load page for a community or game server
- Catching a runaway process or a full disk on a home server before services go down
- Tracking monthly traffic against a provider's bandwidth allowance, with alerts before the cap
Dependencies for Komari
- komari — built from gridalpha/komari-railway, a first-boot entrypoint over the official
ghcr.io/komari-monitor/komari:latestimage. Serves the dashboard, the status page and the agent WebSocket endpoint on port 25774, with a volume at/app/data. - Postgres — Railway's managed PostgreSQL (
ghcr.io/railwayapp-templates/postgres-ssl:18), Komari's monitoring database for metric samples, rollups and latency records. - komari-agent — installed by you on each monitored machine from komari-monitor/komari-agent; not part of this deployment.
Environment Variables Reference
| Variable | Purpose |
|---|---|
KOMARI_ADMIN_USERNAME | Administrator username created on the first boot |
KOMARI_ADMIN_PASSWORD | Administrator password; 8–256 characters with upper case, lower case and a digit |
KOMARI_METRIC_DSN | Monitoring database connection string; set to the Postgres service |
KOMARI_SITE_NAME | Name shown in the dashboard header and page title |
KOMARI_SITE_DESCRIPTION | Tagline shown beside the site name |
KOMARI_DATA_DIR | Volume path for the configuration database, themes and plugins |
PORT | Port the panel listens on |
Deployment Dependencies
- Source: komari-monitor/komari (MIT)
- Documentation: komari.wiki
- Container image:
ghcr.io/komari-monitor/komari - Agent: komari-monitor/komari-agent
Hardware Requirements for Self-Hosting Komari
| Resource | Minimum | Recommended |
|---|---|---|
| CPU | 1 vCPU | 2 vCPU |
| RAM | 512 MB | 1 GB for the panel, plus the managed database |
| Storage | 1 GB volume | 5 GB volume; metric history grows in Postgres |
| Runtime | Go binary on Alpine | Same, behind HTTPS |
The panel's footprint barely moves with node count; the monitoring database grows with nodes multiplied by retention.
Self-Hosting Komari
Outside Railway, Komari runs from one container with a data directory mounted:
docker run -d --name komari -p 25774:25774 -v ./data:/app/data ghcr.io/komari-monitor/komari:latest
Open http://localhost:25774 and complete the installation form — administrator, site name and a monitoring database DSN. For PostgreSQL rather than SQLite, give it a postgresql://user:password@host:5432/dbname DSN; it can be changed later under System → Database.
To build from source instead:
git clone https://github.com/komari-monitor/komari.git
cd komari && go build -o komari .
./komari server
The agent is installed separately on each machine and needs only the panel URL and the node token.
How Much Does Komari Cost to Self-Host?
Komari is free and open source under the MIT licence, with no paid tier, no per-host pricing and no account to create. Self-hosting costs only the infrastructure it runs on: on Railway that is the komari service, the managed Postgres database and the volume, billed by usage. A panel watching a handful of nodes sits at the low end, and the agents add negligible CPU.
FAQ
What is Komari?
Komari is an open-source server monitoring panel. Agents on your machines report system metrics to a self-hosted dashboard with live and historical charts, latency checks, alerts and a browser terminal.
What does this Railway template deploy?
Two services: the Komari panel, with a volume for its configuration database, and a managed PostgreSQL database used as the monitoring store. The administrator account is created on first boot from the variables you provide.
Why does the template include a PostgreSQL database?
Komari keeps configuration in SQLite but stores metric samples in a separate monitoring database that can be SQLite, MySQL or PostgreSQL. Managed Postgres keeps that fast-growing history on a backed-up database.
How do I add a server to self-hosted Komari?
Create the node under Server List, copy the generated install command and run it on the target machine. The agent registers with the token in that command and appears as Online within seconds.
Do I need to open any ports on the machines I monitor?
No. The agent opens an outbound WebSocket to your Komari URL, so monitored machines need no inbound rules. Only the panel is publicly reachable.
Does upgrading Komari lose my data?
No. Configuration lives on the volume and metrics in Postgres, so redeploying pulls a newer image and keeps both.
Template Content