Deploy OpenObserve
Datadog alternative. Observability (logs, metrics, traces), HA cluster
ingester
Just deployed
/data
scheduler
Just deployed
/data
Just deployed
compactor
Just deployed
/data

nats
Just deployed
/data

Just deployed
/var/lib/postgresql/data
Just deployed
/data
openobserve-data
Bucket
Just deployed

Deploy and Host OpenObserve on Railway
OpenObserve is an open source observability platform that keeps logs, metrics, traces and real user monitoring data in one place. It writes everything to S3-compatible object storage as compressed Parquet instead of a hot search index, which is how it reaches roughly 140x lower storage cost than Elasticsearch-backed stacks. Teams reach for it as a Datadog, Splunk or Grafana-stack replacement when observability bills outgrow their value.
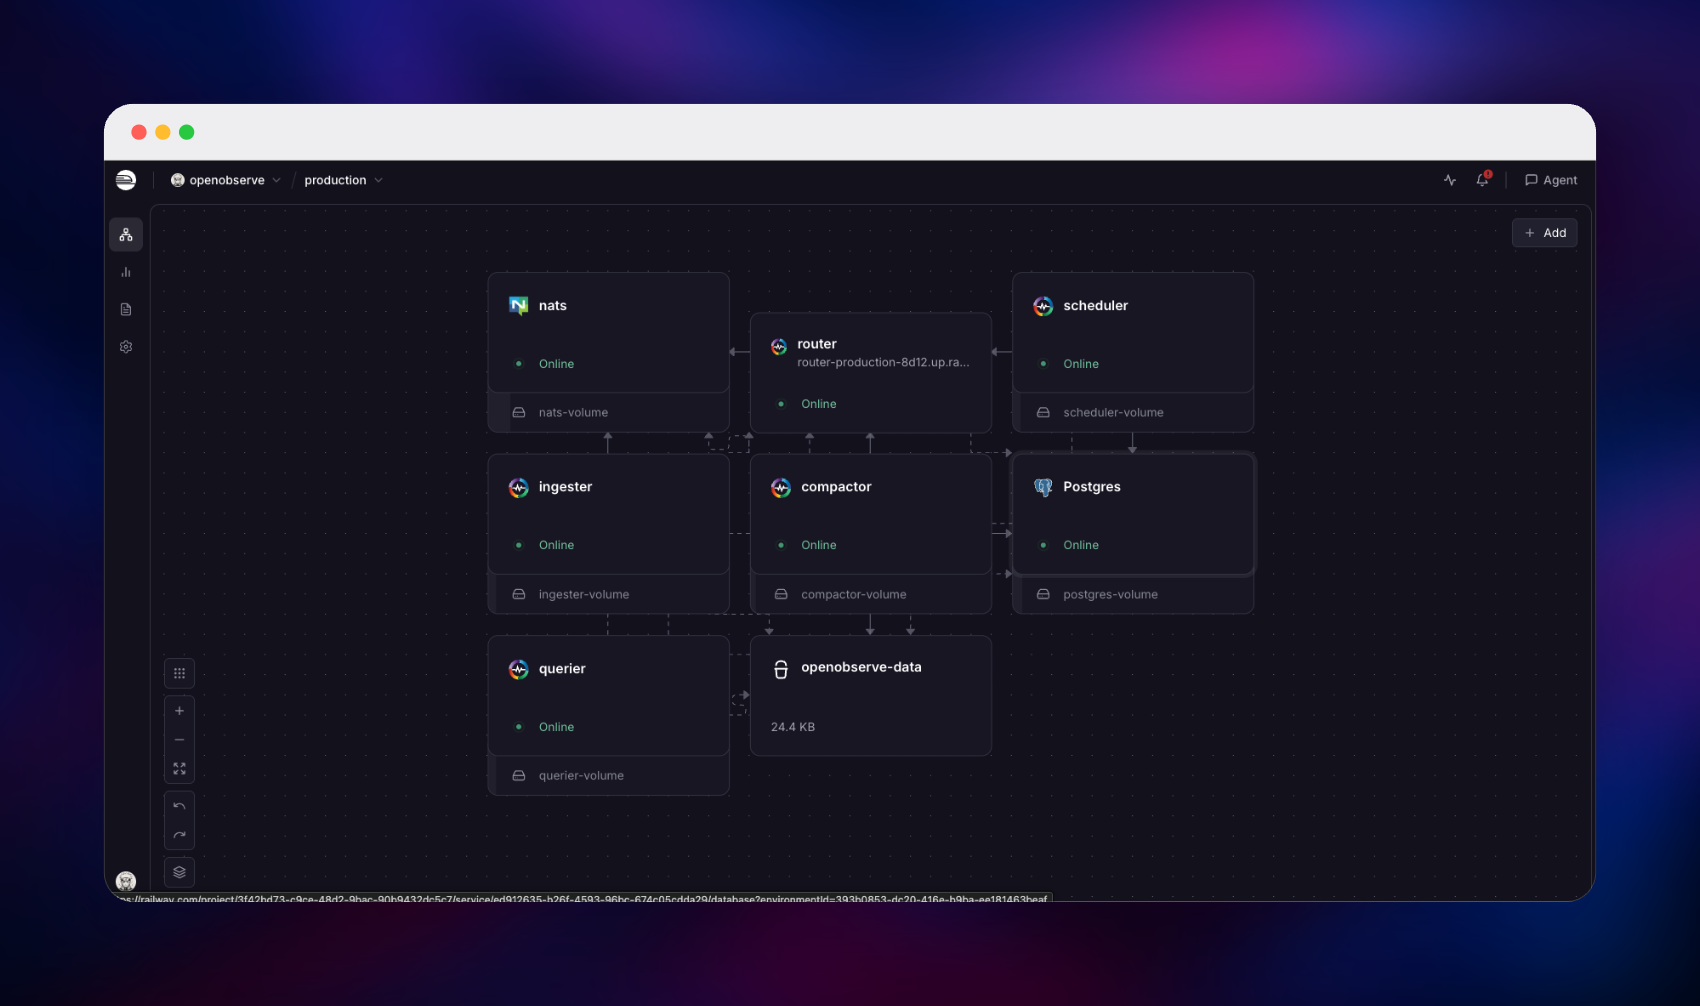
Deploy OpenObserve on Railway in its full high-availability shape rather than as a single container. This template runs the five node roles as separate services — router, ingester, querier, compactor and scheduler — backed by NATS for coordination, PostgreSQL for metadata and an object storage bucket for Parquet. You get a working cluster with a public URL and an admin account on first boot, so you can self-host OpenObserve without Helm charts or hand-wired node discovery.
Getting Started with OpenObserve on Railway
Set ZO_ROOT_USER_EMAIL and ZO_ROOT_USER_PASSWORD before deploying. The password needs 8–128 characters with a lowercase letter, an uppercase letter, a digit and a special character — OpenObserve refuses to start on anything weaker, so do not swap the default for a plain random string.
Once the deploy is green, open the router's public URL and sign in. There is no self-registration screen: the root user is created at first boot, and further users are added under IAM. Then send data — the quickest check is a JSON POST to the ingest endpoint:
curl -u "admin@example.com:YourPassword#1" \
  -H "Content-Type: application/json" \
  -d '[{"level":"info","service":"checkout-api","message":"order placed","latency_ms":42}]' \
  https://your-app.up.railway.app/api/default/my_stream/_json
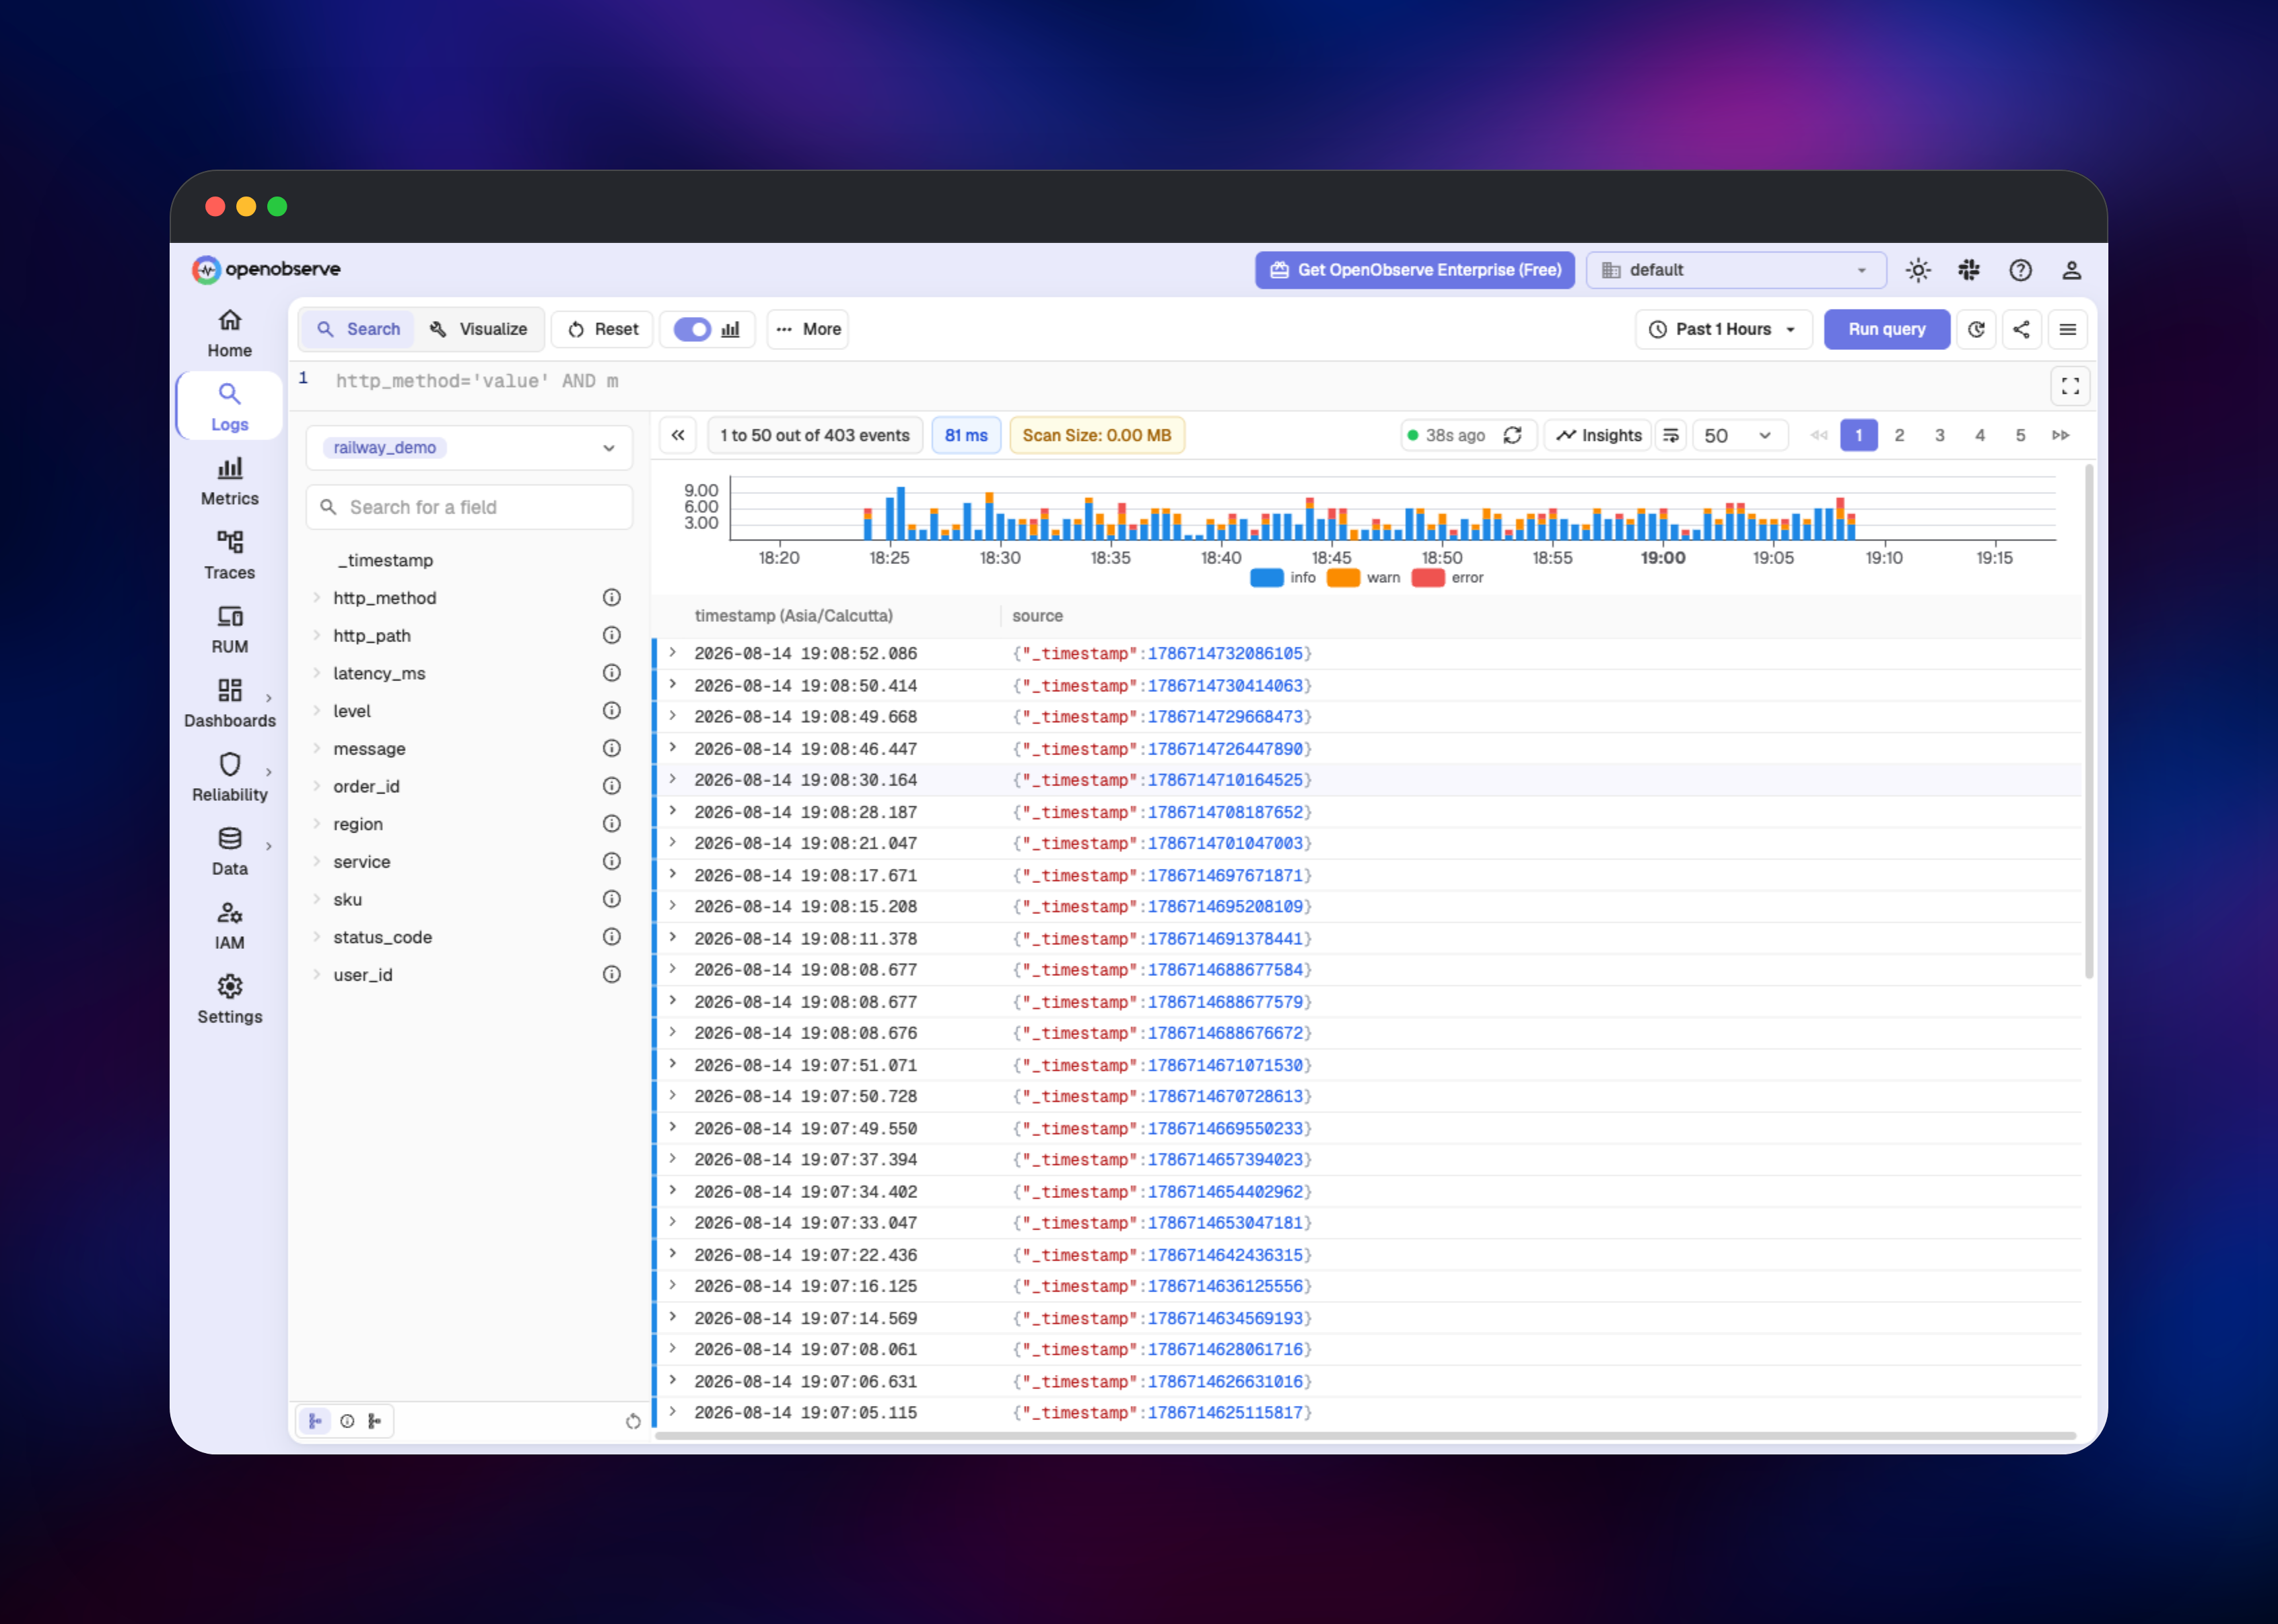
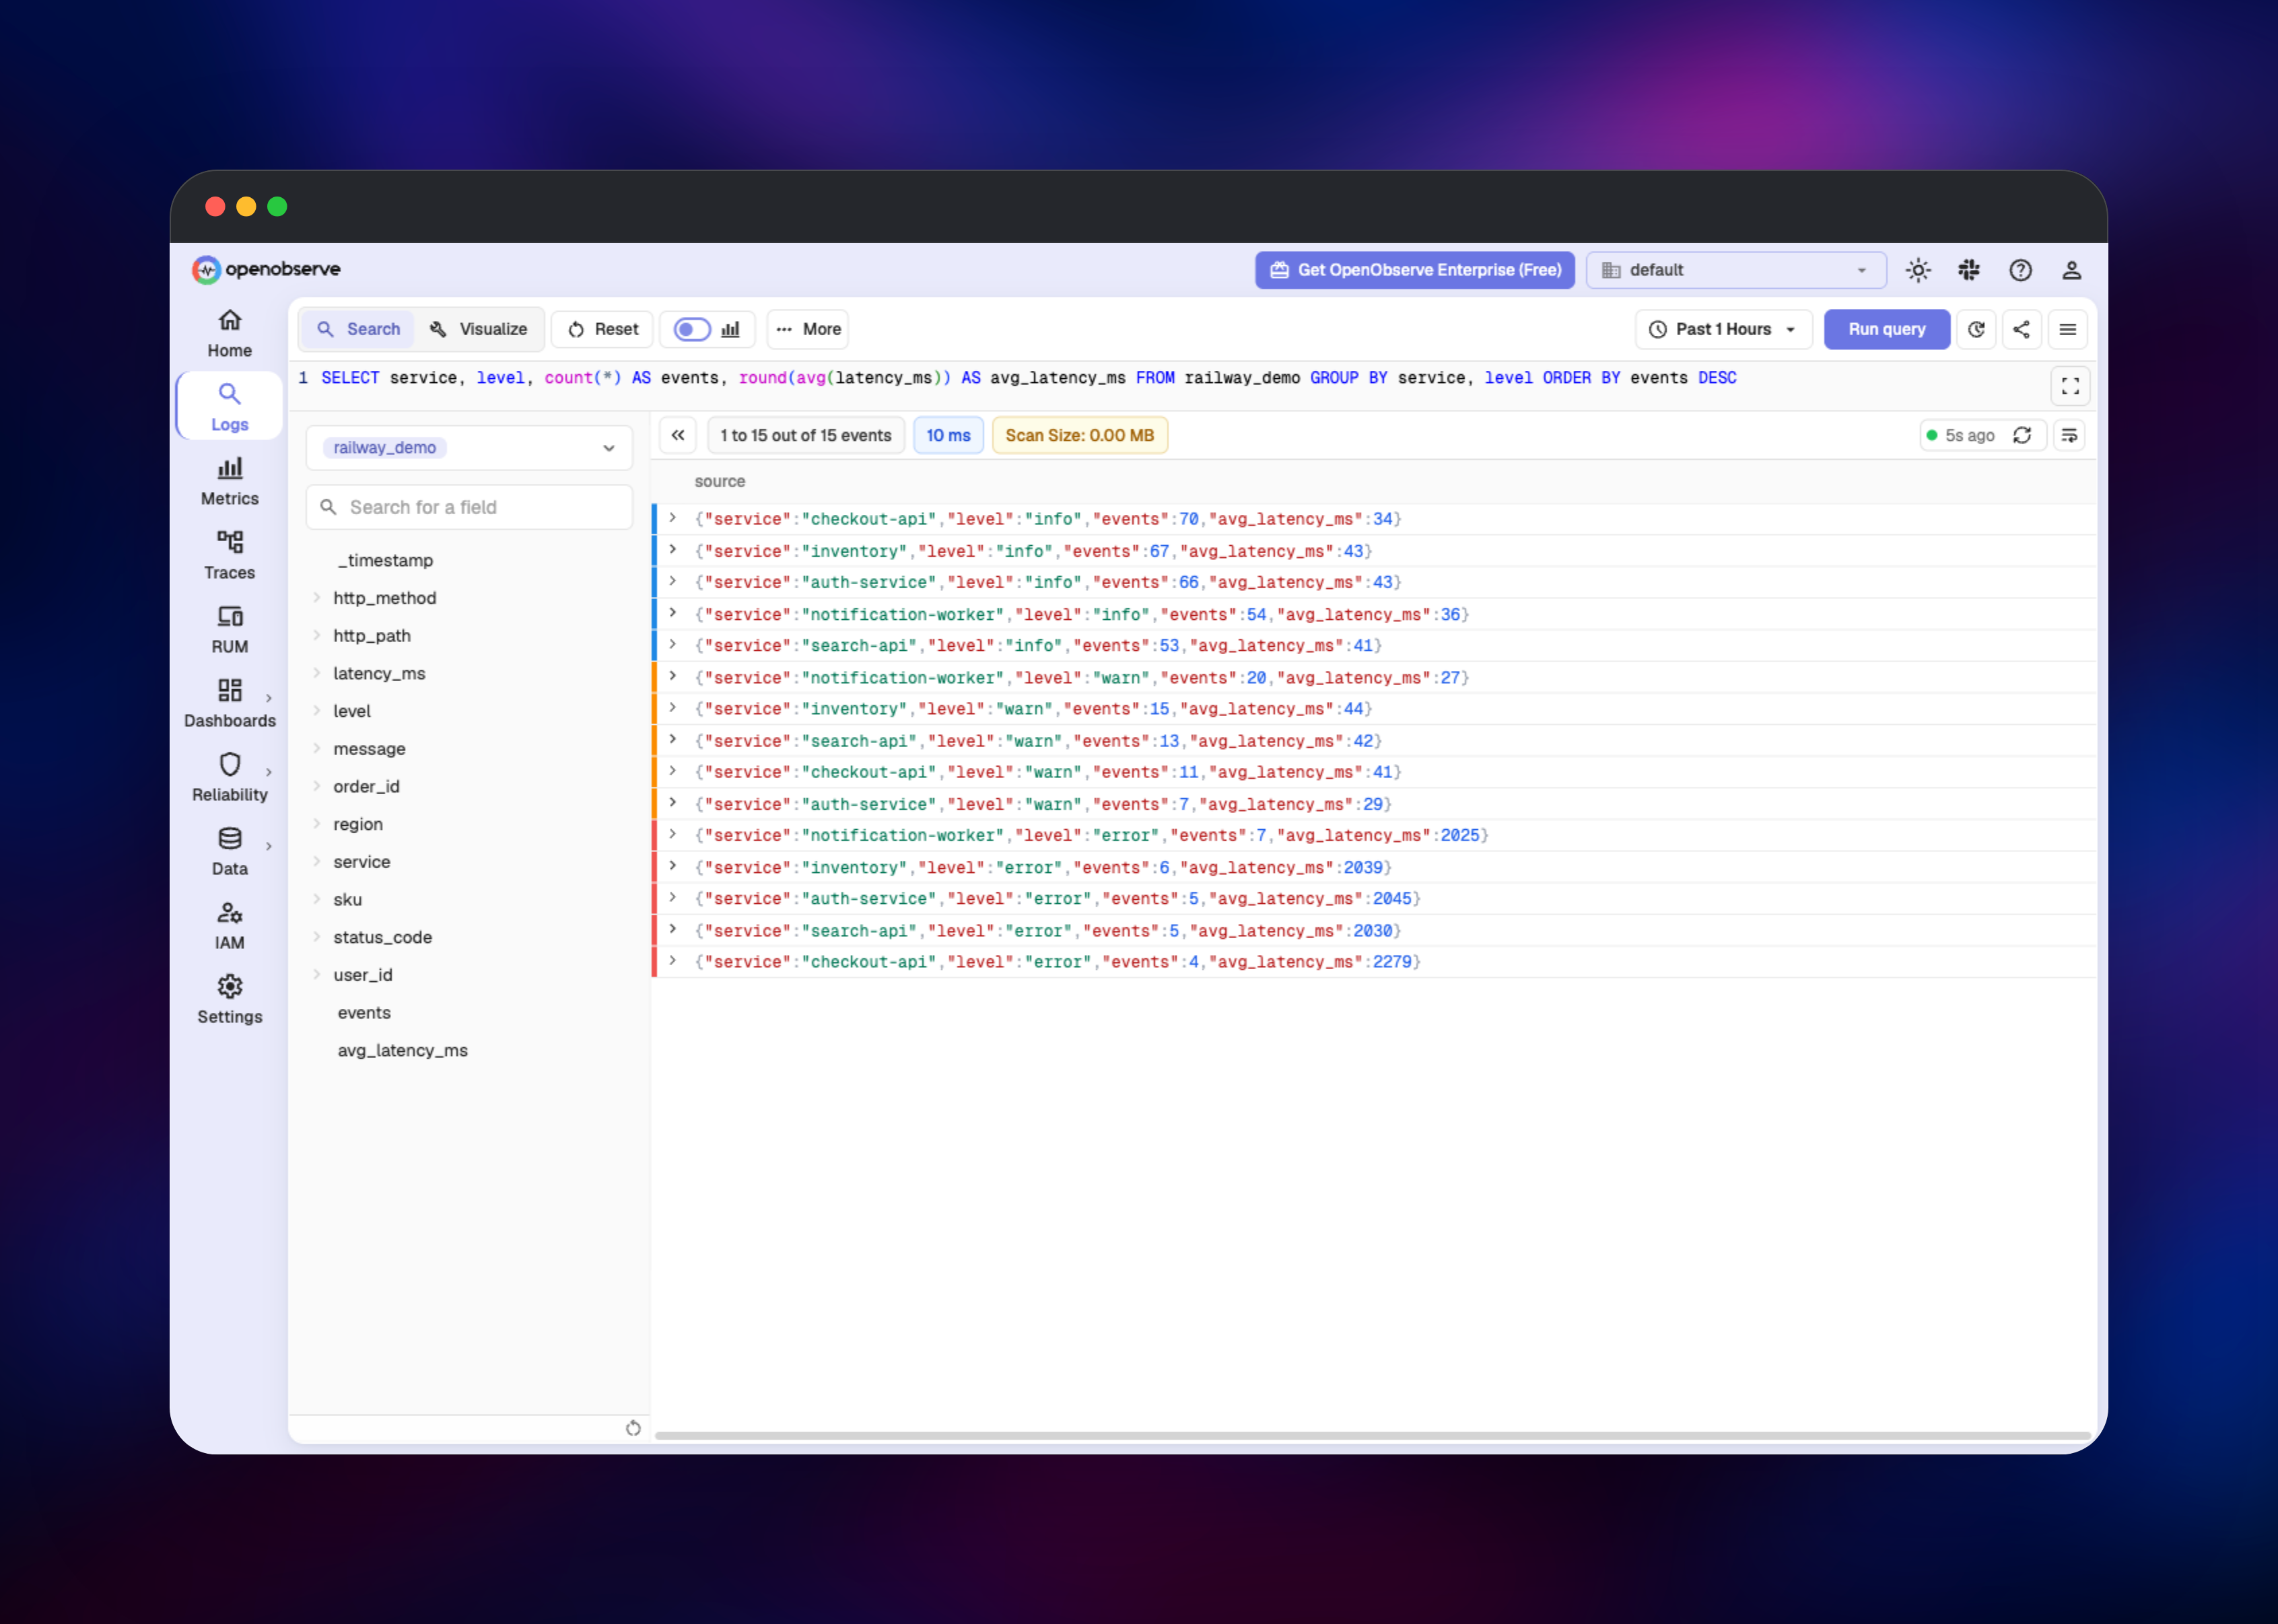
A {"code":200,...,"successful":1} response means the router reached the ingester. Open Logs, pick my_stream, set the range to the last 15 minutes and run a query; switch to SQL mode for aggregates like SELECT service, count(*) FROM my_stream GROUP BY service. Then point real telemetry at the same host over OTLP/HTTP, Fluent Bit or Vector.
About Hosting OpenObserve
OpenObserve is a single Rust binary whose behaviour changes with the role you give it, which is what makes a real cluster practical to run. Self-host it when per-GB SaaS pricing gets painful, or when telemetry cannot leave your own infrastructure.
Key features:
- Logs, metrics, traces and RUM in one platform, no separate Loki/Tempo/Prometheus
- SQL query engine over Parquet, plus PromQL for metrics
- Dashboards, scheduled and real-time alerts, and reports
- Ingest pipelines with VRL transforms for redaction and enrichment
- OpenTelemetry-native, plus Fluent Bit, Vector and Prometheus remote write
How the services fit together: the router is the only public one, forwarding writes to the ingester and reads to the querier. The ingester buffers data in a write-ahead log on its volume, converts it to Parquet and uploads it. The querier reads that Parquet back, caching hot files on disk. The compactor merges small files and applies retention; the scheduler evaluates alerts and reports.
Why Deploy OpenObserve on Railway
Running a five-role observability cluster normally means Kubernetes.
- No Helm charts, node discovery or Kubernetes to operate
- Private networking between all six services out of the box
- Object storage provisioned and wired to the ingester and querier
- Managed PostgreSQL, with no operator to install
- Managed TLS, a public URL and custom domains for the router
- Scale any single role independently when it bottlenecks
Common Use Cases
- Replacing a Datadog or Splunk contract without cutting ingest volume
- Collecting OpenTelemetry traces and logs from services already running on Railway
- Long-retention audit and compliance logging, where object storage keeps years affordable
- Kubernetes observability via Fluent Bit or Vector, as a lighter ELK alternative
Dependencies for OpenObserve
- OpenObserve — five services built from gridalpha/openobserve-railway, based on
public.ecr.aws/zinclabs/openobserve:v0.92.1 - NATS (
nats:2.14-alpine) — cluster coordinator with JetStream; nodes find peers through it - PostgreSQL — cluster metadata store, required in cluster mode
- Object storage bucket — Parquet storage; mandatory in cluster mode, local disk unsupported
All five pin the same tag, because cluster roles must run matching builds.
Environment Variables Reference
| Variable | Description | Required |
|---|---|---|
ZO_ROOT_USER_EMAIL | Admin email created on first boot | Yes |
ZO_ROOT_USER_PASSWORD | Admin password; must pass the strength policy | Yes |
ZO_NODE_ROLE | Role this service runs as | Yes |
ZO_META_POSTGRES_DSN | PostgreSQL metadata connection string | Yes |
ZO_NATS_ADDR | NATS address for node discovery | Yes |
ZO_S3_* | Bucket endpoint, credentials, name and region | Yes |
ZO_DISK_CACHE_MAX_SIZE | Query cache ceiling in MB | Recommended |
ZO_COMPACT_DATA_RETENTION_DAYS | Retention in days, default 3650 | No |
Deployment Dependencies
- Source: https://github.com/openobserve/openobserve · Docs: https://openobserve.ai/docs/
- Image:
public.ecr.aws/zinclabs/openobserve(alsoopenobserve/openobserveon Docker Hub) - Ports: 5080 HTTP (UI, ingest, query), 5081 gRPC (internal)
Server Requirements to Self-Host OpenObserve
Sizing follows ingest rate, not user count. Ingester and querier are the hungry roles.
| Resource | Minimum | Recommended |
|---|---|---|
| CPU | 2 vCPU per role | 4–8 vCPU, ingester and querier |
| RAM | 2 GB per role | 8 GB, ingester and querier |
| Volume | 5 GB per role | 20 GB+, ingester and querier |
| Object storage | Grows with retention | GB/day after ~10–20x compression |
| PostgreSQL | 1 GB | 2 GB+ |
Keep ZO_DISK_CACHE_MAX_SIZE below the querier's volume size — it otherwise defaults to a share of detected free disk, far larger than the volume.
How to Self-Host OpenObserve Outside Railway
A single node on local disk is enough to evaluate:
docker run -d --name openobserve -p 5080:5080 \
  -v $PWD/data:/data -e ZO_DATA_DIR="/data" \
  -e ZO_ROOT_USER_EMAIL="admin@example.com" \
  -e ZO_ROOT_USER_PASSWORD="Complexpass#123" \
  public.ecr.aws/zinclabs/openobserve:latest
Cluster mode needs PostgreSQL, NATS and object storage. Every node runs the same image and settings with a different ZO_NODE_ROLE:
ZO_LOCAL_MODE="false"
ZO_NODE_ROLE="ingester"
ZO_META_STORE="postgres"
ZO_META_POSTGRES_DSN="postgres://user:pass@postgres:5432/openobserve"
ZO_NATS_ADDR="nats:4222"
ZO_NATS_REPLICAS="1"
ZO_S3_PROVIDER="s3"
ZO_S3_SERVER_URL="https://s3.example.com"
ZO_S3_BUCKET_NAME="openobserve"
ZO_S3_ACCESS_KEY="key"
ZO_S3_SECRET_KEY="secret"
Valid roles are all, ingester, querier, compactor, router, alertmanager, flatten_compactor and action_server; an unrecognised role stops the process at startup. Nodes register their own address for peers to dial, so where that auto-detected address is not routable between hosts, set ZO_HTTP_ADDR and ZO_GRPC_ADDR explicitly — both take an IP literal, not a hostname.
Is OpenObserve Free?
The open source edition is AGPL-3.0 and free forever, cluster mode included — nothing here needs a licence. A self-hosted Enterprise edition is free up to 50 GB/day, adding SSO, RBAC, audit trails and data redaction. OpenObserve Cloud is separate, usage-based at roughly $0.30/GB ingested. On Railway you pay only for compute, volumes, database and object storage.
FAQ
What is OpenObserve? An open source observability platform for logs, metrics, traces and RUM that stores data as Parquet in object storage — a cheaper alternative to Datadog, Splunk and Elasticsearch.
What does this Railway template deploy? A full cluster: router, ingester, querier, compactor and scheduler, plus NATS, PostgreSQL and an object storage bucket. Only the router is publicly reachable.
Why does the template include PostgreSQL and NATS? Cluster mode requires both. PostgreSQL stores schemas, users, dashboards and alerts; NATS is how nodes discover one another. A single node could use SQLite, but roles then cannot scale independently.
Why is my object storage bucket empty right after ingesting data?
Data sits in the ingester's write-ahead log until it rotates, 10 minutes by default; queries still return it. Lower ZO_MAX_FILE_RETENTION_TIME for sooner uploads.
Can I send OpenTelemetry data to self-hosted OpenObserve?
Yes. OTLP over HTTP works against the router's public URL at /api/<org>/v1/logs, /v1/metrics and /v1/traces. OTLP over gRPC uses port 5081, kept private here.
How do I scale OpenObserve when ingest grows? Add replicas to the saturated role. Ingesters absorb write throughput and queriers handle search concurrency; both scale horizontally because state lives in object storage. Note the Streams page refreshes stats only every 30 minutes.
Template Content
ingester
gridalpha/openobserve-railwayscheduler
gridalpha/openobserve-railwaycompactor
gridalpha/openobserve-railwaynats
nats:2.14-alpineopenobserve-data
Bucket