
Deploy Prometheus
Metrics database that scrapes, stores and alerts on time series

alertmanager
Just deployed
/alertmanager
blackbox-exporter
Just deployed
prometheus
Just deployed
/prometheus
Deploy and Host Prometheus on Railway
Prometheus is the metrics database most of the cloud-native world runs on. It pulls numeric time series from HTTP endpoints your services already expose, stores them in its own compressed on-disk database, and lets you query them in PromQL — the language behind almost every Grafana dashboard you have seen. It is a graduated CNCF project, Apache-2.0 licensed, and the reason "just expose /metrics" became a convention.
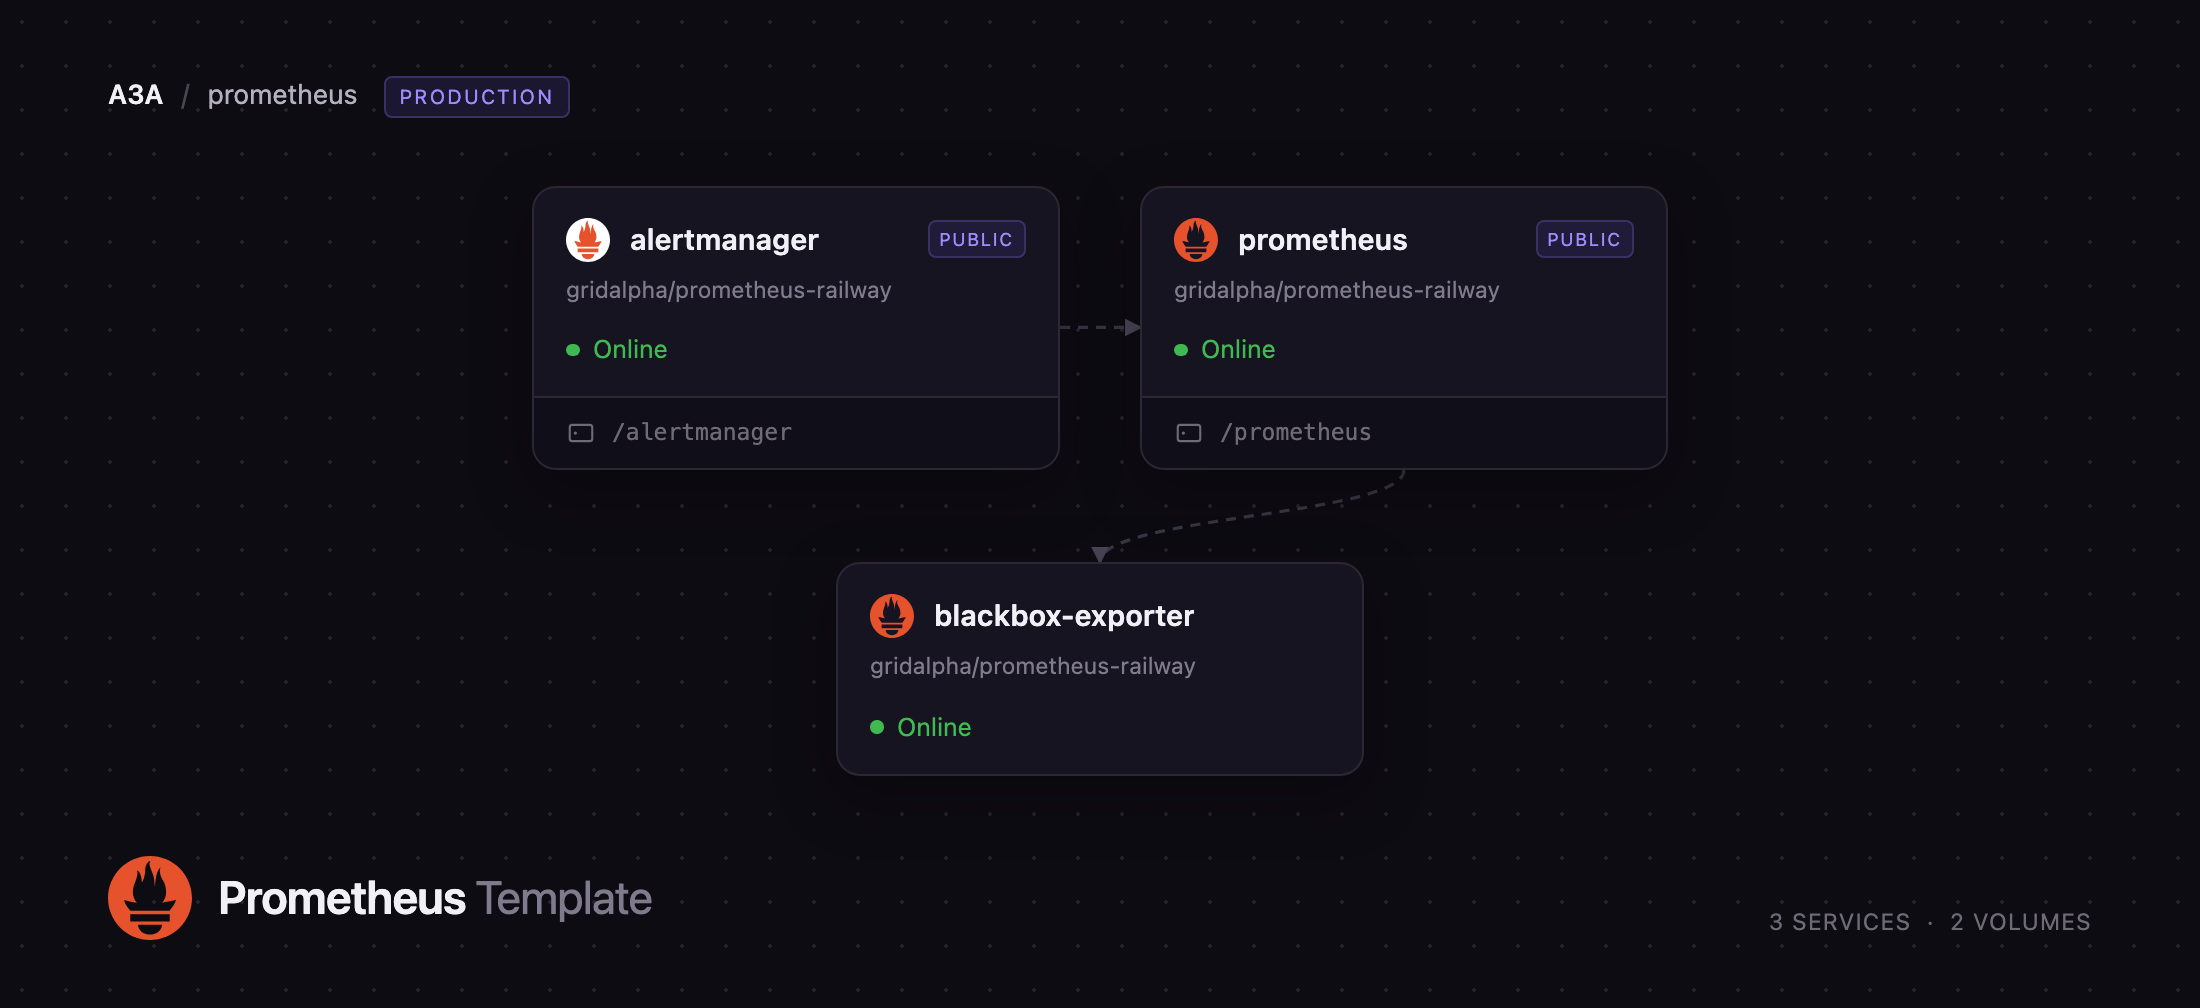
Deploy Prometheus on Railway and you get three services rather than one. prometheus scrapes and stores metrics and evaluates alerting rules. alertmanager receives the alerts it fires, groups and deduplicates them, and delivers them to Slack, email or a webhook. blackbox-exporter probes URLs from outside, so you can watch endpoints that expose no metrics. Both prometheus and alertmanager are published behind HTTP basic authentication and keep their data on a Railway volume; blackbox-exporter stays private.
Getting Started with Prometheus on Railway
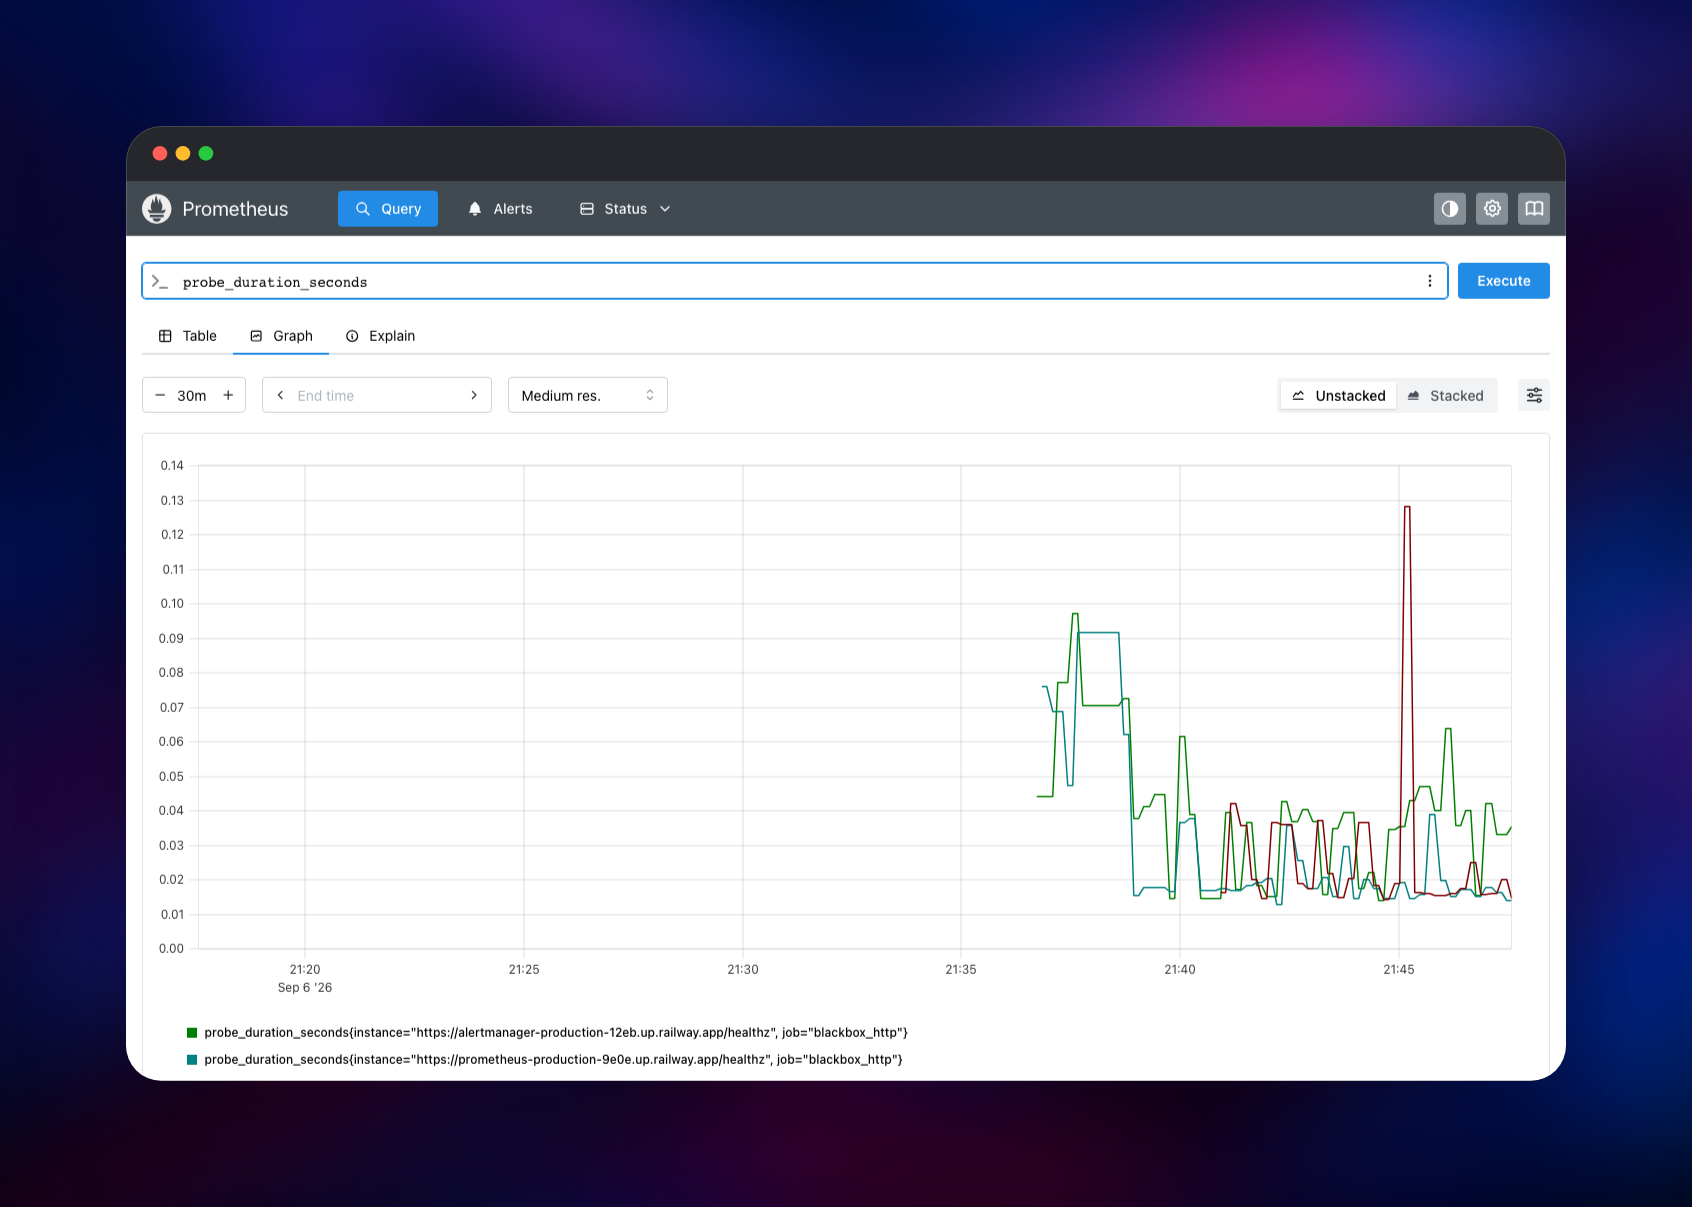
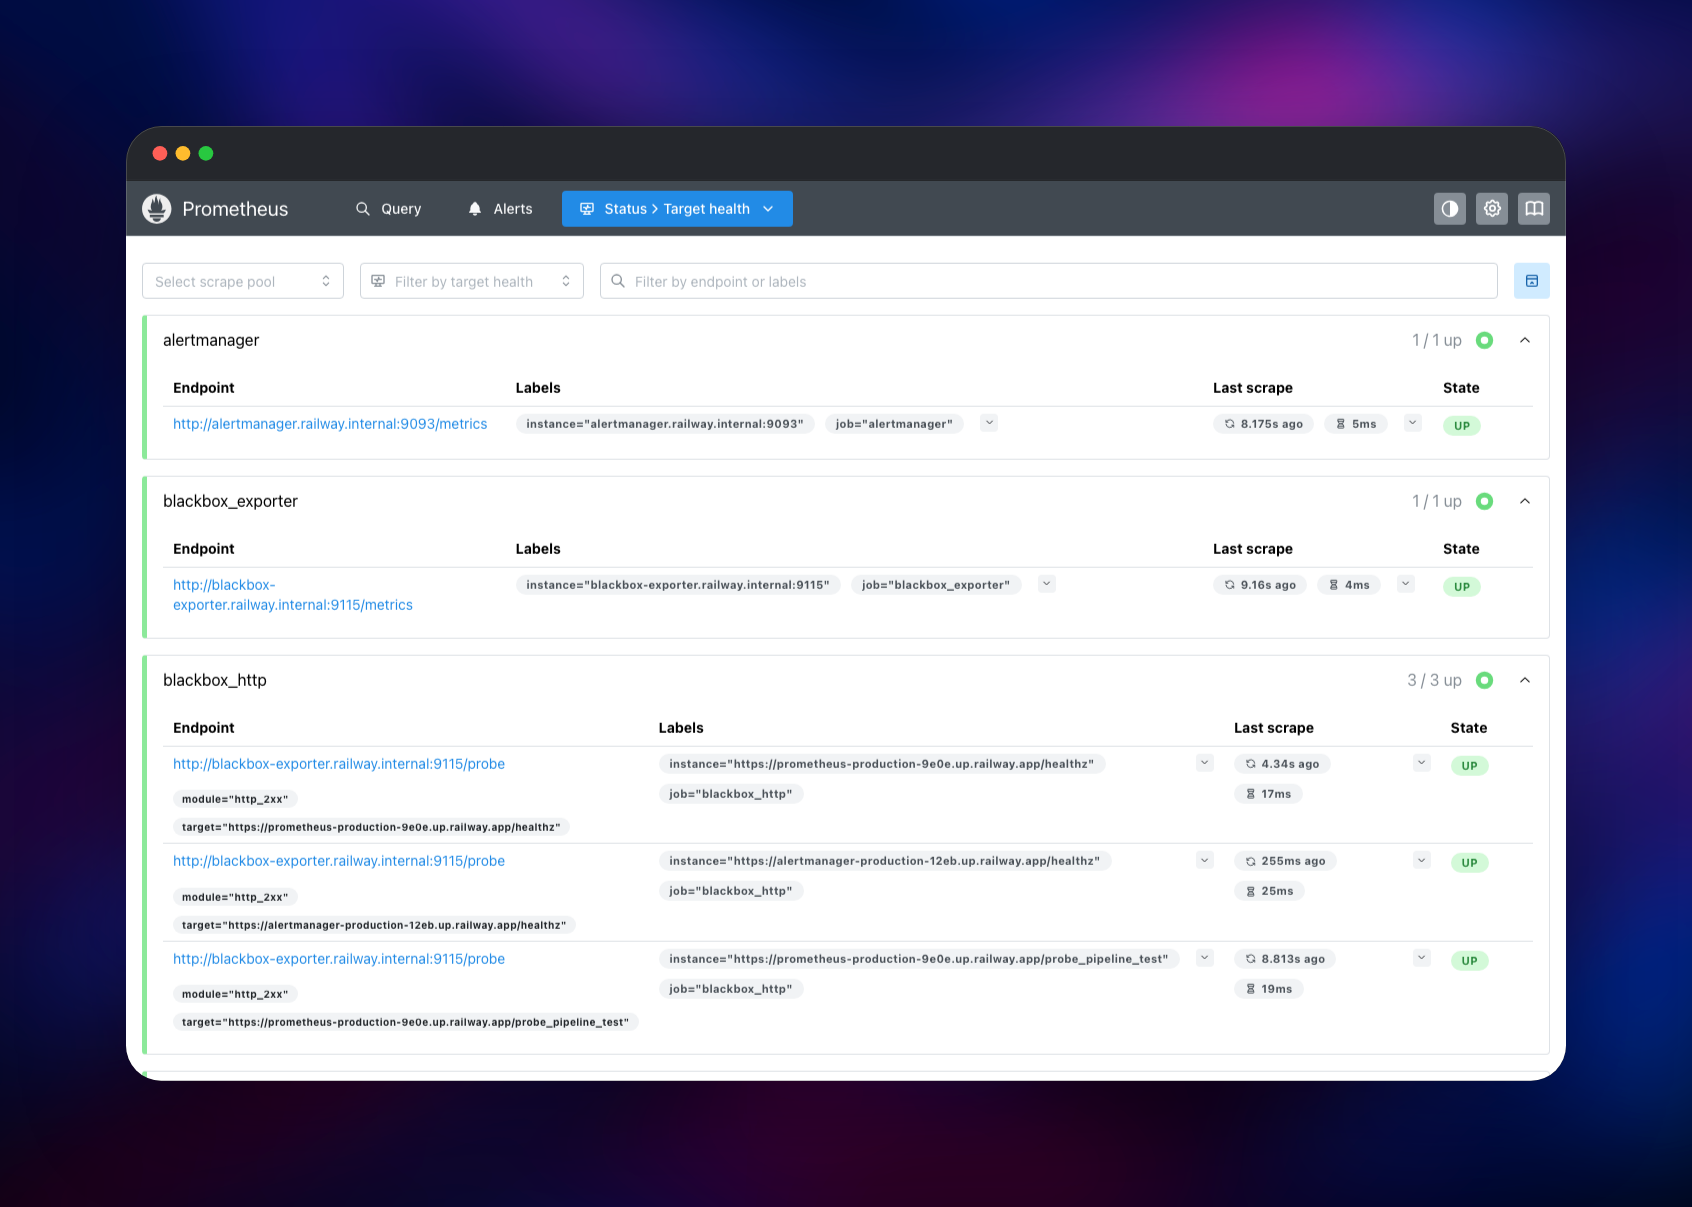
Open the prometheus service's public URL. The browser asks for a username and password: the AUTH_USERNAME and AUTH_PASSWORD variables on that service, admin and a generated value you can read in Railway's variables panel. There is no signup screen and no first-run wizard — Prometheus is already scraping. Go to Status → Target health: five targets should read UP — Prometheus itself, Alertmanager, the blackbox exporter and two probes of your own deployment. Then open Query, type probe_duration_seconds and switch to the Graph tab to see real data.
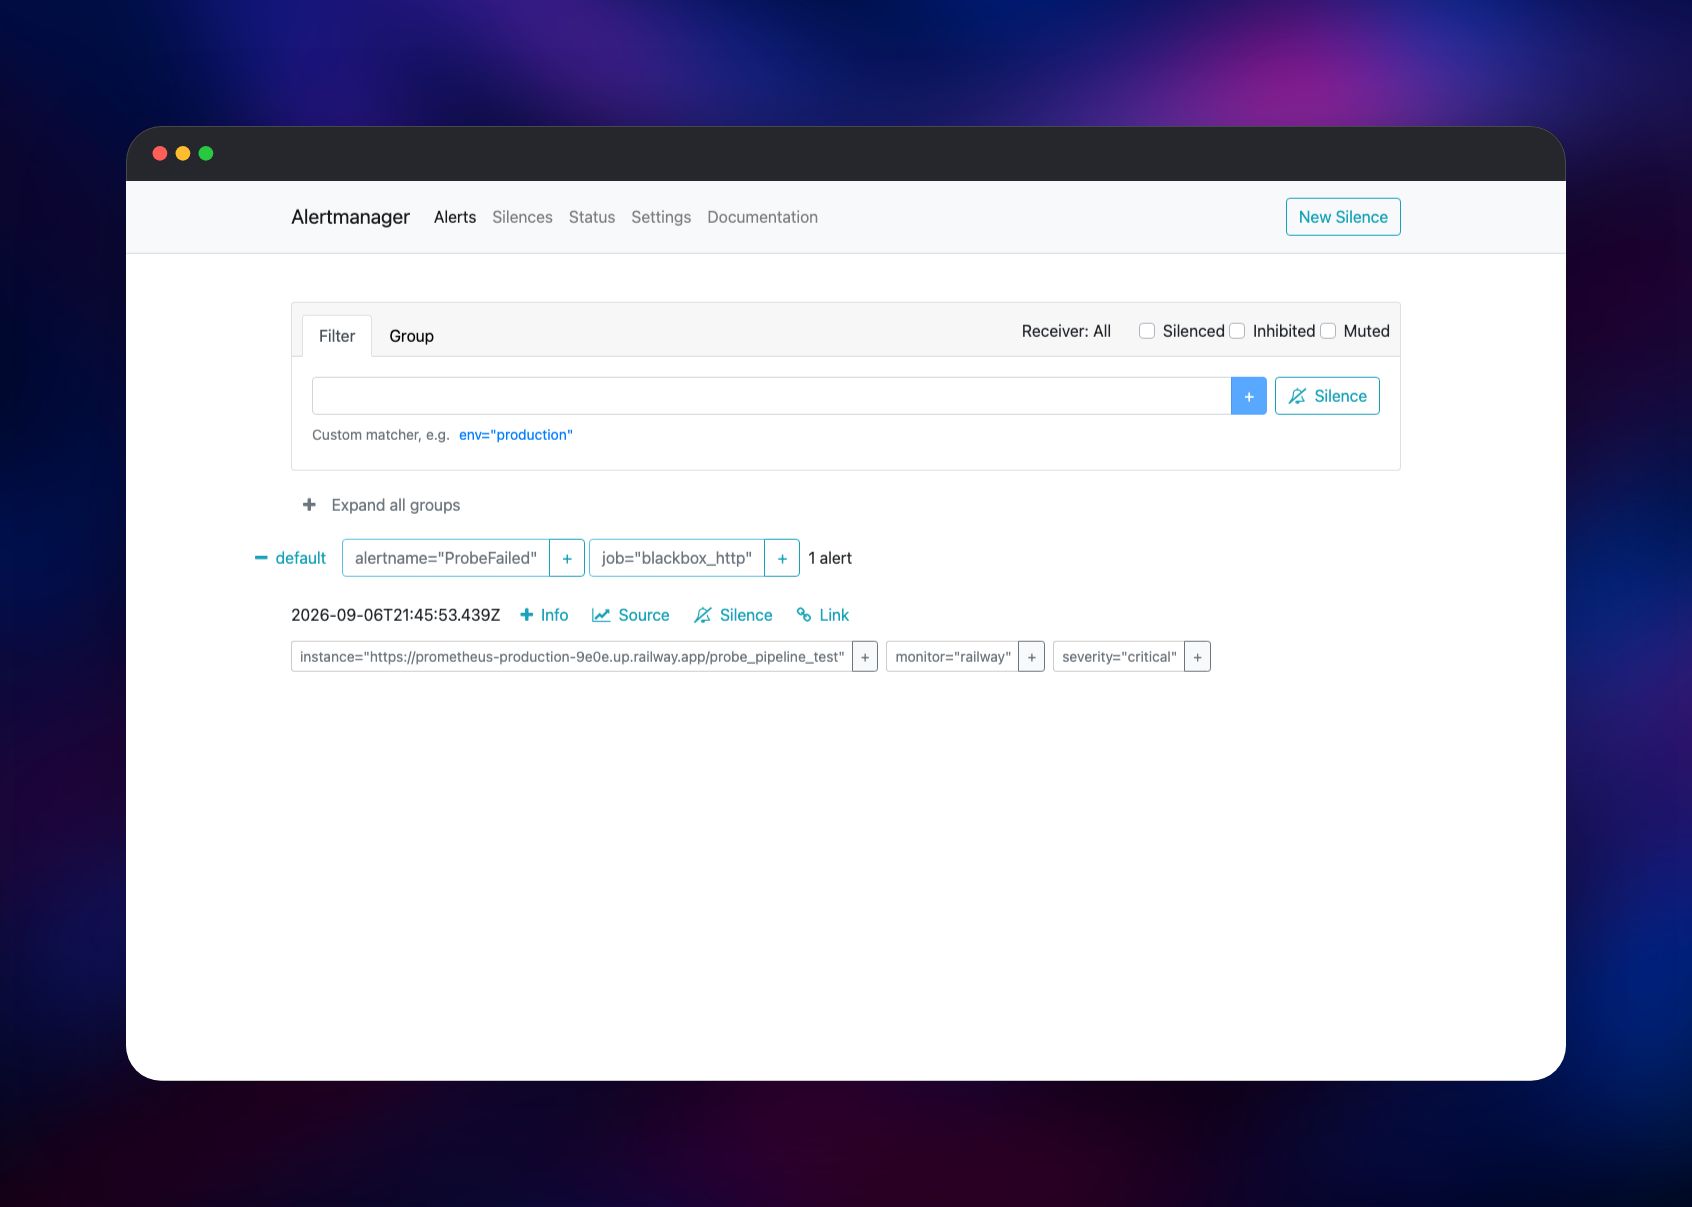
To monitor your own services, set SCRAPE_TARGETS to a comma-separated list of private hostnames and ports, such as api.railway.internal:8080,worker.railway.internal:9100; for URLs that expose no metrics, use PROBE_TARGETS. The alertmanager service has its own URL and credentials, and seven alerting rules ship enabled, so a target down for five minutes appears there with no further configuration.
About Hosting Prometheus
Prometheus is a single Go binary with an embedded time-series database. It scrapes rather than receives: you tell it where the endpoints are and it fetches them on an interval, so a service that crashes stops answering and Prometheus notices at once. Self-hosting keeps every metric in your own infrastructure, with no per-host or per-metric billing.
Key features:
- PromQL, a query language for time series, with rate, histogram and aggregation functions
- Pull-based scraping over plain HTTP: instrumenting a service means exposing one endpoint
- Alerting rules evaluated continuously against the same data you graph
- A local TSDB with configurable time- and size-based retention
- Client libraries for Go, Python, Java, Ruby, Rust and Node.js
- Grafana as a first-class consumer — Prometheus is its most common data source
The three services split the job the way the upstream project intends. Prometheus owns collection, storage and rule evaluation. Alertmanager owns what happens after an alert fires: grouping, silencing, inhibition and routing. The blackbox exporter owns probing — it turns "can this URL be reached, and is its certificate valid?" into metrics Prometheus scrapes like any other target.
Why Deploy Prometheus on Railway
Railway removes the operational work self-hosted monitoring usually brings:
- Persistent volumes for the metrics database and Alertmanager's silences
- A private network, so Prometheus scrapes your other services by hostname
- HTTPS and a public domain for both web interfaces, with basic auth in front
- Health checks and automatic restarts on all three services
Common Use Cases
- Application metrics — chart request rate, latency and error ratio from your services'
/metricsendpoints - Uptime monitoring — probe public URLs and alert before a TLS certificate expires
- A Grafana backend — point Grafana at the private Prometheus endpoint and build dashboards on top
- On-call alerting — route firing alerts to Slack or email, with silences during deploys
Dependencies for Prometheus
prom/prometheus:v3— the server, TSDB and rule engineprom/alertmanager:v0— alert grouping, silencing and deliveryprom/blackbox-exporter— HTTP, TCP and DNS probing
All three build from github.com/gridalpha/prometheus-railway, which adds an authenticating gateway and renders the YAML configuration from environment variables at boot.
Environment Variables Reference
| Service | Variable | Default | Purpose |
|---|---|---|---|
| prometheus | AUTH_USERNAME / AUTH_PASSWORD | admin / generated | Basic auth for the UI and API |
| prometheus | SCRAPE_TARGETS | empty | Comma-separated host:port list to scrape |
| prometheus | PROBE_TARGETS | its own URLs | Comma-separated URLs to probe |
| prometheus | RETENTION_TIME | 15d | How long samples are kept |
| prometheus | RETENTION_SIZE | 4GB | Size cap; keep under the volume size |
| alertmanager | SLACK_WEBHOOK_URL | empty | Send alerts to a Slack channel |
| alertmanager | SMTP_SMARTHOST / ALERT_EMAIL_TO | empty | Send alerts by email |
Deployment Dependencies
- Source: github.com/prometheus/prometheus
- Documentation: prometheus.io/docs
- No external database, cache or object storage is required
Hardware Requirements for Self-Hosting Prometheus
| Resource | Minimum | Recommended |
|---|---|---|
| CPU | 0.5 vCPU | 2 vCPU |
| RAM | 512 MB | 2 GB |
| Storage | 5 GB volume | 10–50 GB volume |
| Runtime | Linux container | Linux container |
Memory scales with active time series, a few kilobytes each; disk scales with series count times retention. Keep RETENTION_SIZE below the volume size so old blocks are discarded rather than filling the disk.
Self-Hosting Prometheus
The quickest local run mounts a config file into the official image. Create prometheus.yml:
global:
  scrape_interval: 15s
scrape_configs:
  - job_name: prometheus
    static_configs:
      - targets: ["localhost:9090"]
Then start the container, mounting the config and a named volume for the database:
docker run -d --name prometheus -p 9090:9090 \
  -v $(pwd)/prometheus.yml:/etc/prometheus/prometheus.yml \
  -v prometheus-data:/prometheus \
  prom/prometheus:v3 \
  --config.file=/etc/prometheus/prometheus.yml \
  --storage.tsdb.path=/prometheus \
  --storage.tsdb.retention.time=15d
Prometheus ships no authentication beyond a bcrypt-hashed --web.config.file, so never expose port 9090 to the internet without a proxy in front. That is the gap this template closes.
How Much Does Prometheus Cost to Self-Host?
Prometheus, Alertmanager and the blackbox exporter are free and open source under the Apache 2.0 licence. There is no paid edition, no per-host pricing and no metric quota — the limits are your CPU, memory and disk. On Railway you pay only for the compute and volume the three services use, a few dollars a month for a small deployment, against per-host or per-series billing from hosted monitoring.
FAQ
What is Prometheus? An open-source monitoring system and time-series database. It scrapes metrics from HTTP endpoints on a schedule, stores them locally, and lets you query and alert on them with PromQL. It is a graduated CNCF project and the de facto standard for metrics in container environments.
What does this Railway template deploy?
Three services: prometheus (server and database, with a volume), alertmanager (alert routing and silencing, with its own volume), and blackbox-exporter (URL probing, private). Both web interfaces are published over HTTPS behind basic authentication.
Why does the template include Alertmanager and a blackbox exporter? Prometheus deliberately does not deliver notifications — it evaluates rules and hands firing alerts to Alertmanager, which handles grouping, deduplication, silencing and routing. The blackbox exporter covers endpoints that expose no metrics, where you only need to know whether they answer and whether their certificate is valid.
How do I add my own services to self-hosted Prometheus?
Set SCRAPE_TARGETS on the prometheus service to a comma-separated list of host:port pairs, using private hostnames such as api.railway.internal:8080. The configuration is rebuilt on the next deployment and the new job appears under Status → Target health.
Can I connect Grafana to this Prometheus?
Yes. Deploy Grafana in the same project and use http://prometheus.railway.internal:9090 as the data source URL. That port is reachable on the private network without credentials; only the public gateway requires basic auth.
How long does Prometheus keep my metrics, and does it need a database?
Fifteen days by default, capped at 4 GB, via RETENTION_TIME and RETENTION_SIZE; whichever limit is hit first deletes the oldest blocks. No external database is involved — everything lives in Prometheus' own time-series database on the attached volume.
Template Content
alertmanager
gridalpha/prometheus-railwayblackbox-exporter
gridalpha/prometheus-railwayprometheus
gridalpha/prometheus-railway