Deploy Uptime Kuma - Open Source Alternative to UptimeRobot
Self-host Uptime Kuma for real-time uptime monitoring and alerts
Uptime Kuma
Just deployed
/app/data
Deploy and Host uptime-kuma on Railway
Deploy Uptime Kuma on Railway in under 60 seconds with this one-click template. Get a production-ready, self-hosted monitoring dashboard with automatic SSL, persistent storage, and zero infrastructure management. This template uses the official louislam/uptime-kuma:1 Docker image and provisions everything you need to monitor your services, websites, and APIs from a single elegant interface.
About Hosting uptime-kuma
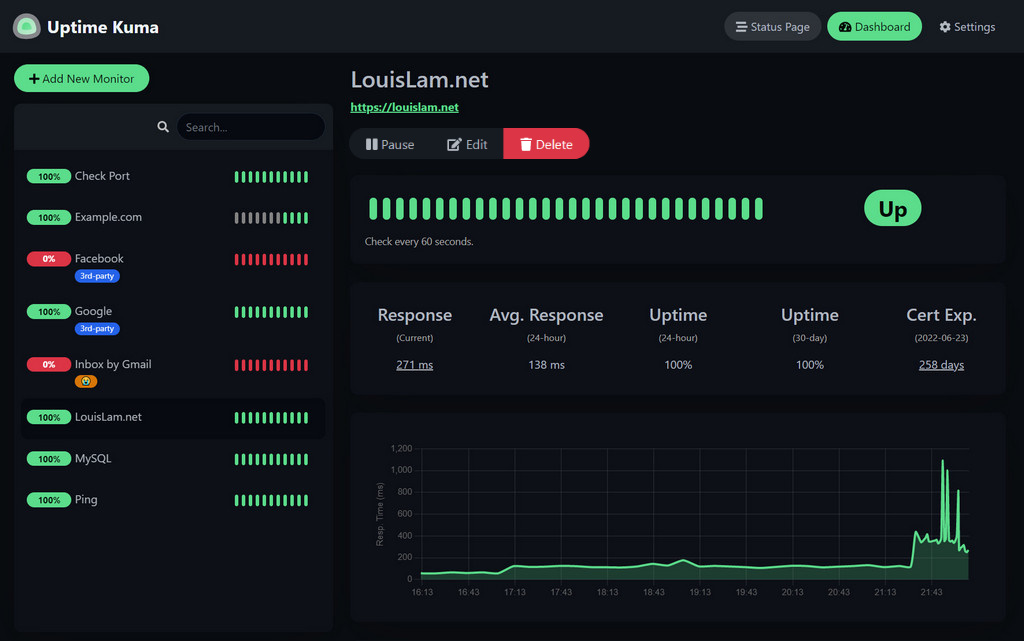
Uptime Kuma is an open-source, self-hosted monitoring tool that tracks the availability and performance of your web services, APIs, servers, and Docker containers. Created as a modern alternative to commercial uptime monitors, it combines powerful monitoring capabilities with an exceptionally clean UI that developers actually enjoy using.
Key Features:
- Multi-Protocol Monitoring — HTTP(s), TCP, ping, DNS, WebSocket, Docker containers
- 90+ Notification Integrations — Uptime Kuma provides Discord, Slack, Telegram, email, webhooks via Apprise
- Public Status Pages — Share uptime dashboards with clients or teams
- Lightweight Architecture — Runs on SQLite, requiring minimal resources (512MB RAM)
- Push Monitors — Heartbeat endpoints for cron jobs and scheduled tasks
- Certificate Monitoring — Track SSL/TLS expiration automatically
- Two-Factor Authentication — Secure your dashboard with 2FA
- Prometheus Metrics — Export data via
/metricsendpoint
Single Node.js application with embedded SQLite stored at /app/data — your entire monitoring configuration lives in one file.
Common Use Cases of Uptime Kuma
- SaaS monitoring — Track production API endpoints with Discord/Slack alerts and a public
status.yourapp.compage - Home lab — Monitor Plex, Nextcloud, Home Assistant, and internal IPs that external SaaS tools cannot reach
- Client websites — Agencies monitoring dozens of client sites from one dashboard with per-client status pages
- Cron job health checks — Push monitors alert you when nightly backups or scheduled tasks silently fail
- SSL expiration tracking — Catch certificate expiry before it causes outages
- Internal API monitoring — Monitor private endpoints over Railway's internal network without public exposure
- Database connectivity — TCP port checks on PostgreSQL/Redis without exposing credentials
Dependencies for Uptime Kuma Hosting
Uptime Kuma is entirely self-contained with zero external dependencies. The embedded SQLite database eliminates the need for PostgreSQL, MySQL, or Redis.
Deployment Dependencies
Minimum requirements: 512MB RAM, 1GB persistent storage, single vCPU. No external services required.
Adding an HTTP(S) monitor:
// Example: Monitoring a REST API endpoint
Monitor Type: HTTP(s)
Friendly Name: Production API Health
URL: https://api.yourapp.com/health
Heartbeat Interval: 60 seconds
Retries: 3
Accepted Status Codes: 200-299

// Advanced settings
Request Method: GET
Request Headers:
  Authorization: Bearer your-api-key
  User-Agent: UptimeKuma/1.0

Expected Response:
  {"status":"healthy"}
Creating Public Status Pages in Uptime Kuma
Status pages transform Uptime Kuma from an internal tool into a customer-facing communication channel. Navigate to Status Pages in the sidebar and click New Status Page.
Configuration example:
# Status page settings
Title: "MyApp System Status"
URL Slug: /status
Description: "Real-time status of MyApp services"

# Monitor groups
Groups:
  - Name: "Core Services"
    Monitors:
      - Production API
      - Authentication Service
      - Database Primary

  - Name: "CDN & Assets"
    Monitors:
      - CloudFront Distribution
      - S3 Bucket Availability
Notification Configuration
Uptime Kuma's notification system uses Apprise, supporting 90+ services through a unified interface. Configure notifications in Settings → Notifications.
Email via SMTP:
Notification Type: SMTP (Email)
Friendly Name: Admin Alerts

Host: smtp.gmail.com
Port: 587
Security: TLS
Username: alerts@yourapp.com
Password: your-app-password
From Email: alerts@yourapp.com
To Email: admin@yourapp.com, oncall@yourapp.com

Custom Subject: [ALERT] {monitor.name} is {monitor.status}
Notification strategies:
- Critical services: Multiple channels (Discord + Email + SMS)
- Non-critical services: Single channel with grouped alerts
- Maintenance windows: Temporarily disable notifications to prevent alert fatigue
Configure notification groups to avoid duplicate alerts when multiple monitors fail simultaneously—useful when a network outage affects several services.
Backup and Data Persistence
Your entire Uptime Kuma configuration lives in /app/data/kuma.db, a single SQLite file. Railway's persistent volumes ensure this survives container restarts, but you should implement additional backups for disaster recovery.
Why Deploy Uptime Kuma on Railway
Railway transforms Uptime Kuma deployment from a 15-minute Docker configuration exercise into a single click.
Automatic HTTPS — SSL certificates and reverse proxy handled automatically. No Nginx, no Caddy, no Let's Encrypt renewals.
Persistent Volumes — Monitoring data survives container restarts automatically. No Docker volume syntax to remember.
Zero-Downtime Deployments — Health checks ensure new containers are ready before traffic switches over.
$5 Free Credit Monthly — Uptime Kuma's tiny resource footprint means the free tier covers small-to-medium workloads indefinitely.
Private Networking — Monitor other Railway services via private network addresses without public exposure.
Compared to a DigitalOcean VPS, you eliminate firewall setup, reverse proxy configuration, SSL management, and Docker Compose maintenance entirely.
Uptime Kuma vs Competitors
Uptime Kuma vs UptimeRobot
UptimeRobot's free tier caps at 50 monitors with 5-minute check intervals. Uptime Kuma gives you unlimited monitors at 20-second intervals. The decisive difference: UptimeRobot runs from external servers and cannot reach internal services, private IPs, or localhost. Uptime Kuma can monitor anything your Railway deployment can reach. UptimeRobot paid plans start at $7/month — Uptime Kuma on Railway's free tier costs nothing.
Uptime Kuma vs Prometheus + Grafana
Prometheus + Grafana are powerful but require deploying and maintaining multiple services, configuring exporters, and writing PromQL. Uptime Kuma is a complete solution in a single container with a UI non-technical stakeholders can read instantly. They're not mutually exclusive — Uptime Kuma exposes a /metrics endpoint so you can scrape uptime data into Prometheus for unified observability.
Uptime Kuma vs Better Uptime / Statuspage.io
Commercial status page tools charge $20-$100/month for features Uptime Kuma provides free. The trade-off is global monitoring locations (checking from multiple continents) and dedicated support, which commercial tools offer. For most teams, Uptime Kuma's self-hosted approach wins on cost and privacy.
Uptime Kuma vs Statping-ng
The closest open-source alternative, but Statping development has been inconsistent. Uptime Kuma has more active development, better documentation, and significantly more notification integrations (90+ vs ~20). GitHub star count and contributor activity both favour Uptime Kuma by a wide margin.
FAQ
Is Uptime Kuma truly free and open source?
Yes — MIT licensed, no usage limits, no licensing fees. Actively maintained at louislam/uptime-kuma with 50,000+ GitHub stars.
Can Uptime Kuma monitor internal services not publicly accessible? Yes, this is its key advantage over SaaS tools. It can reach private IPs, localhost, internal APIs, and Railway private network addresses — anything the host can reach.
What happens to monitoring data if Railway has an outage? Data is stored in Railway's persistent volumes. Checks pause during any outage, but historical data is preserved.
How many monitors one instance of Uptime Kuma can handle? 512MB RAM handles 50–100 monitors at 60-second intervals comfortably. Increase to 1GB for 200+ monitors or 20-second intervals. SQLite remains performant well beyond 500 monitors, though the UI gets unwieldy at that scale.
Can I migrate from UptimeRobot? No native import tool exists, but Uptime Kuma's API allows scripting monitor creation from exported CSV data for large deployments.
Does Uptime Kuma support team access? Multiple user accounts with admin/non-admin roles are supported. Granular per-monitor permissions are not currently available — all authenticated users see all monitors.
Template Content
Uptime Kuma
louislam/uptime-kuma