Deploy VictoriaMetrics
Time-series database for storing and querying metrics
Just deployed
Just deployed
/storage

alertmanager
Just deployed
/alertmanager
Just deployed
Just deployed
/vmagentdata
Just deployed
Just deployed

Deploy and Host VictoriaMetrics on Railway
VictoriaMetrics is an open-source time-series database and monitoring stack that speaks the Prometheus remote-write and query APIs, so anything already writing to Prometheus can write to it unchanged. Teams adopt it when one Prometheus server stops being enough: it stores the same metrics in far less disk space, answers queries over months of history, and separates ingestion from querying so a dashboard cannot stall a scrape. It serves as long-term storage behind Grafana, as a drop-in Prometheus replacement, and as a metrics backend for teams who would rather run one dependency than a stack of sidecars.
Deploy VictoriaMetrics in its cluster shape rather than as a single box. Seven services come up together: vmstorage holds the data on a persistent volume, vminsert accepts writes and shards them across storage nodes, vmselect answers MetricsQL and PromQL queries, and vmauth is the only public service, authenticating every request and routing it to the right tier. vmagent scrapes each component back into the cluster, vmalert evaluates the project's rules, and Alertmanager delivers what fires. Everything but the gateway stays private.
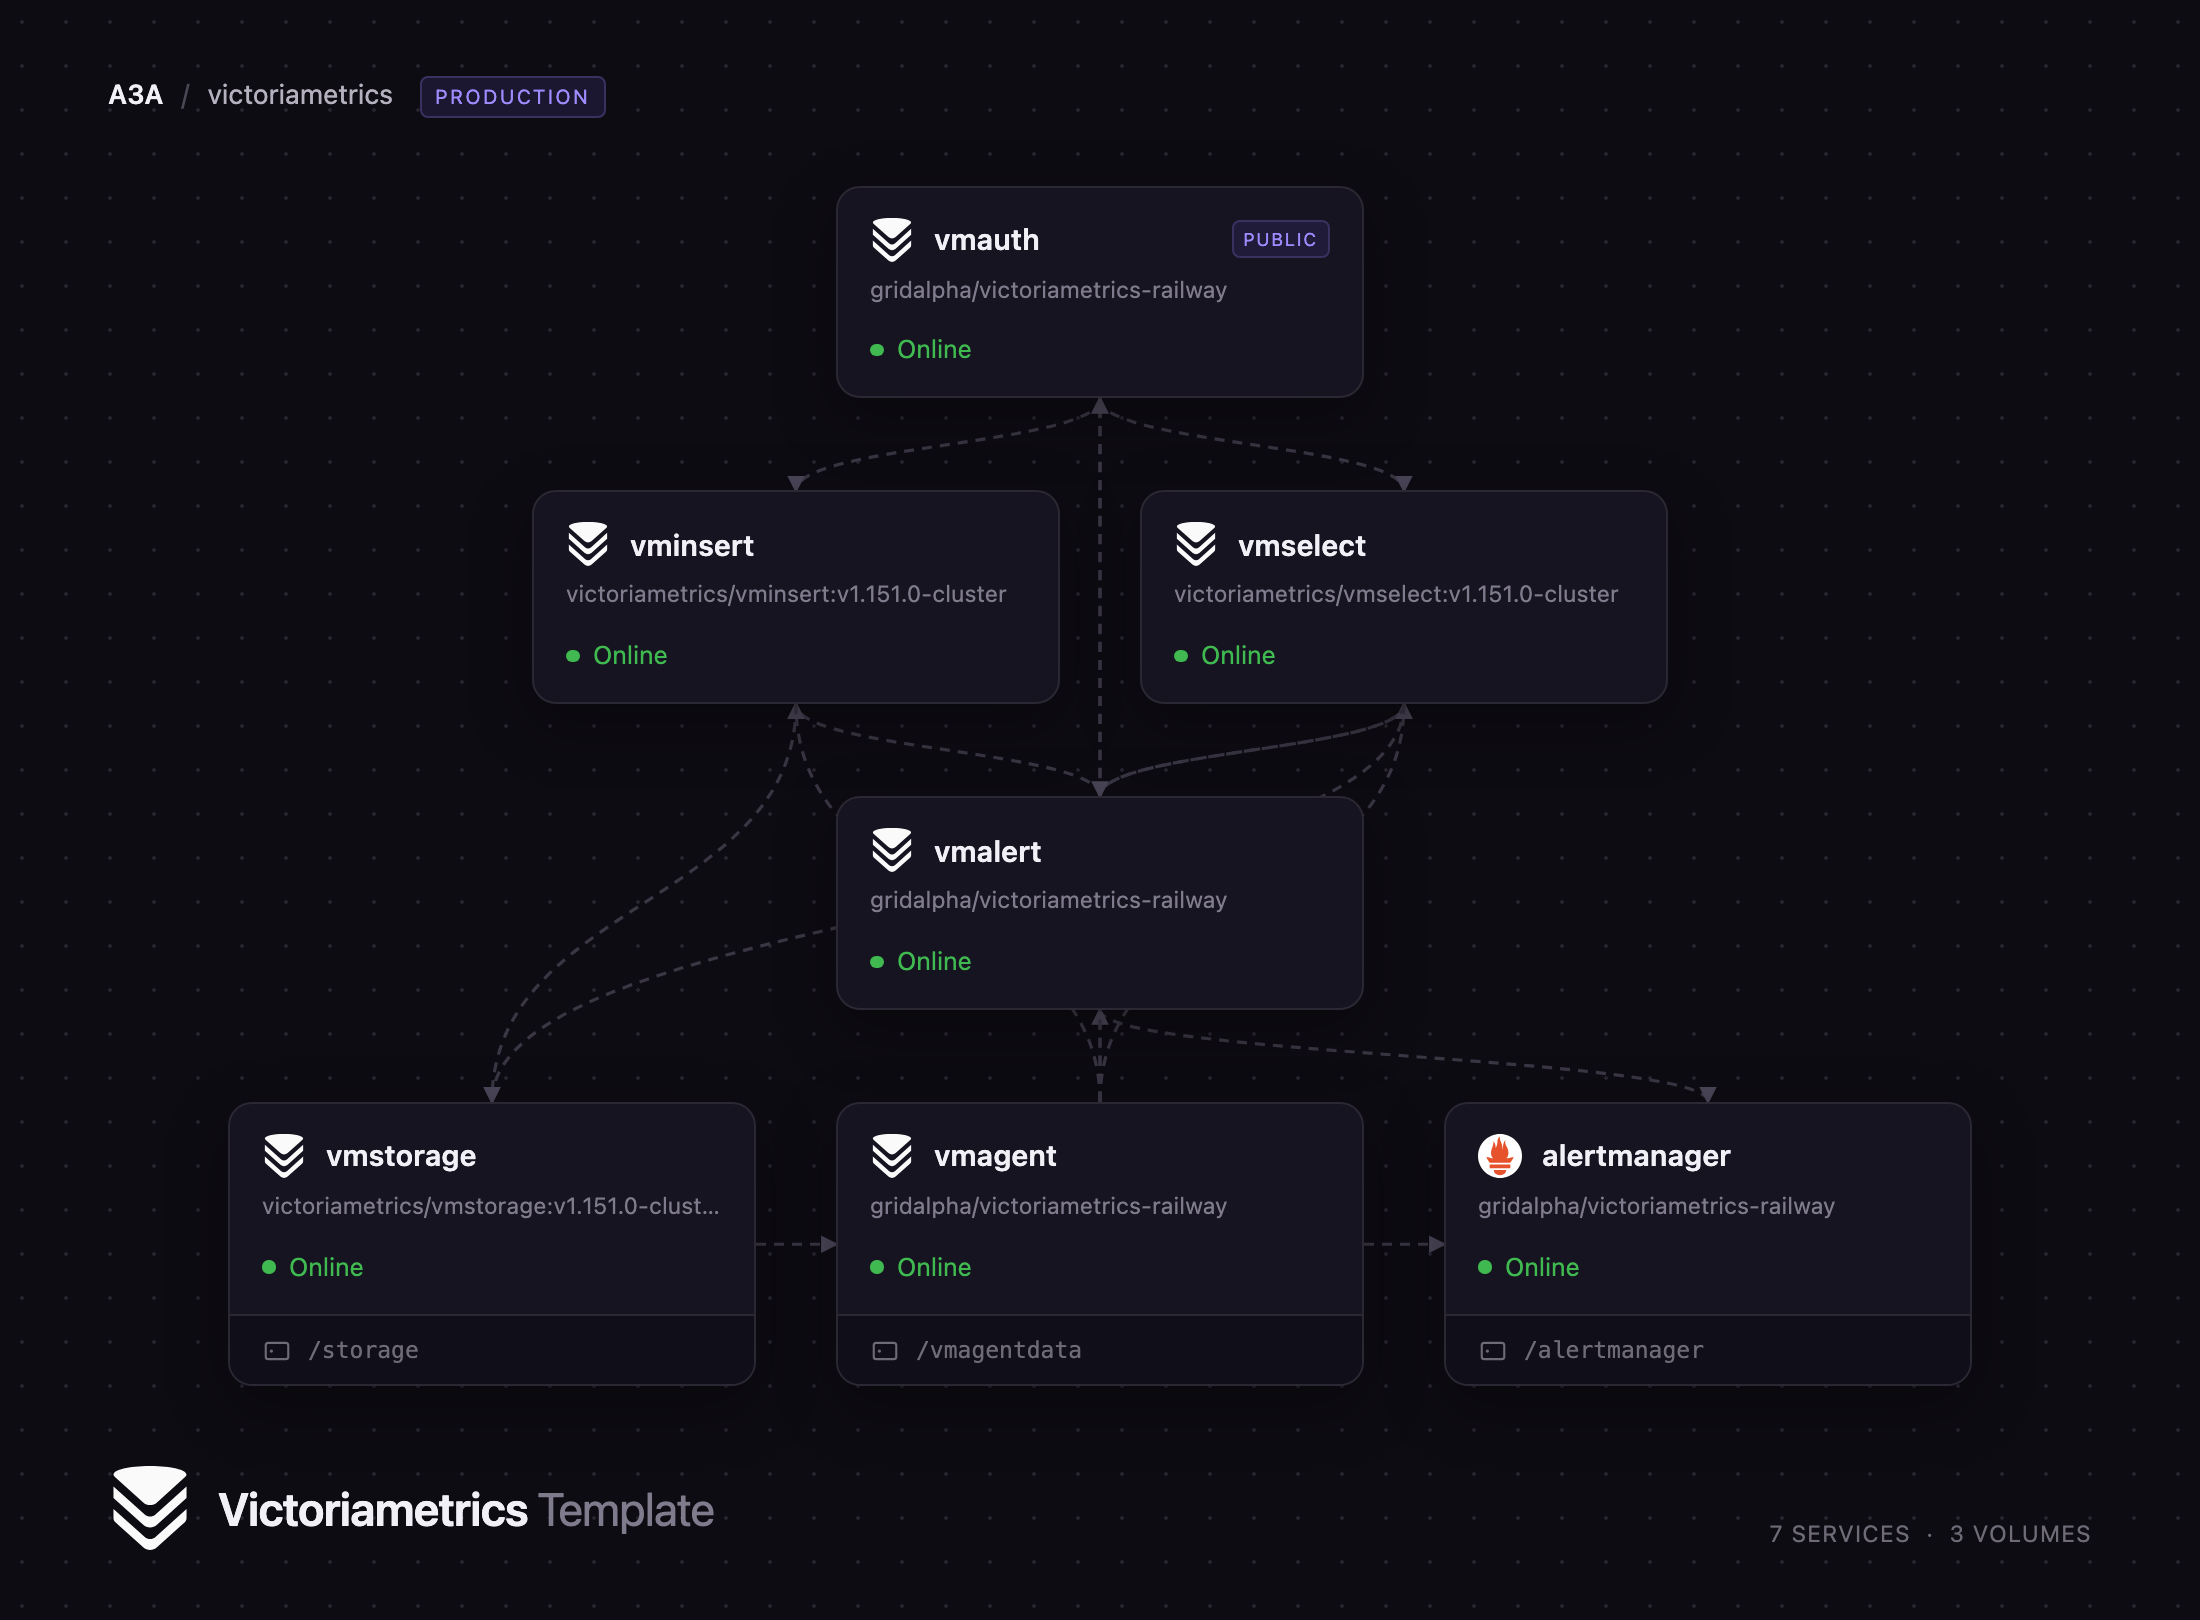
Getting Started with VictoriaMetrics on Railway
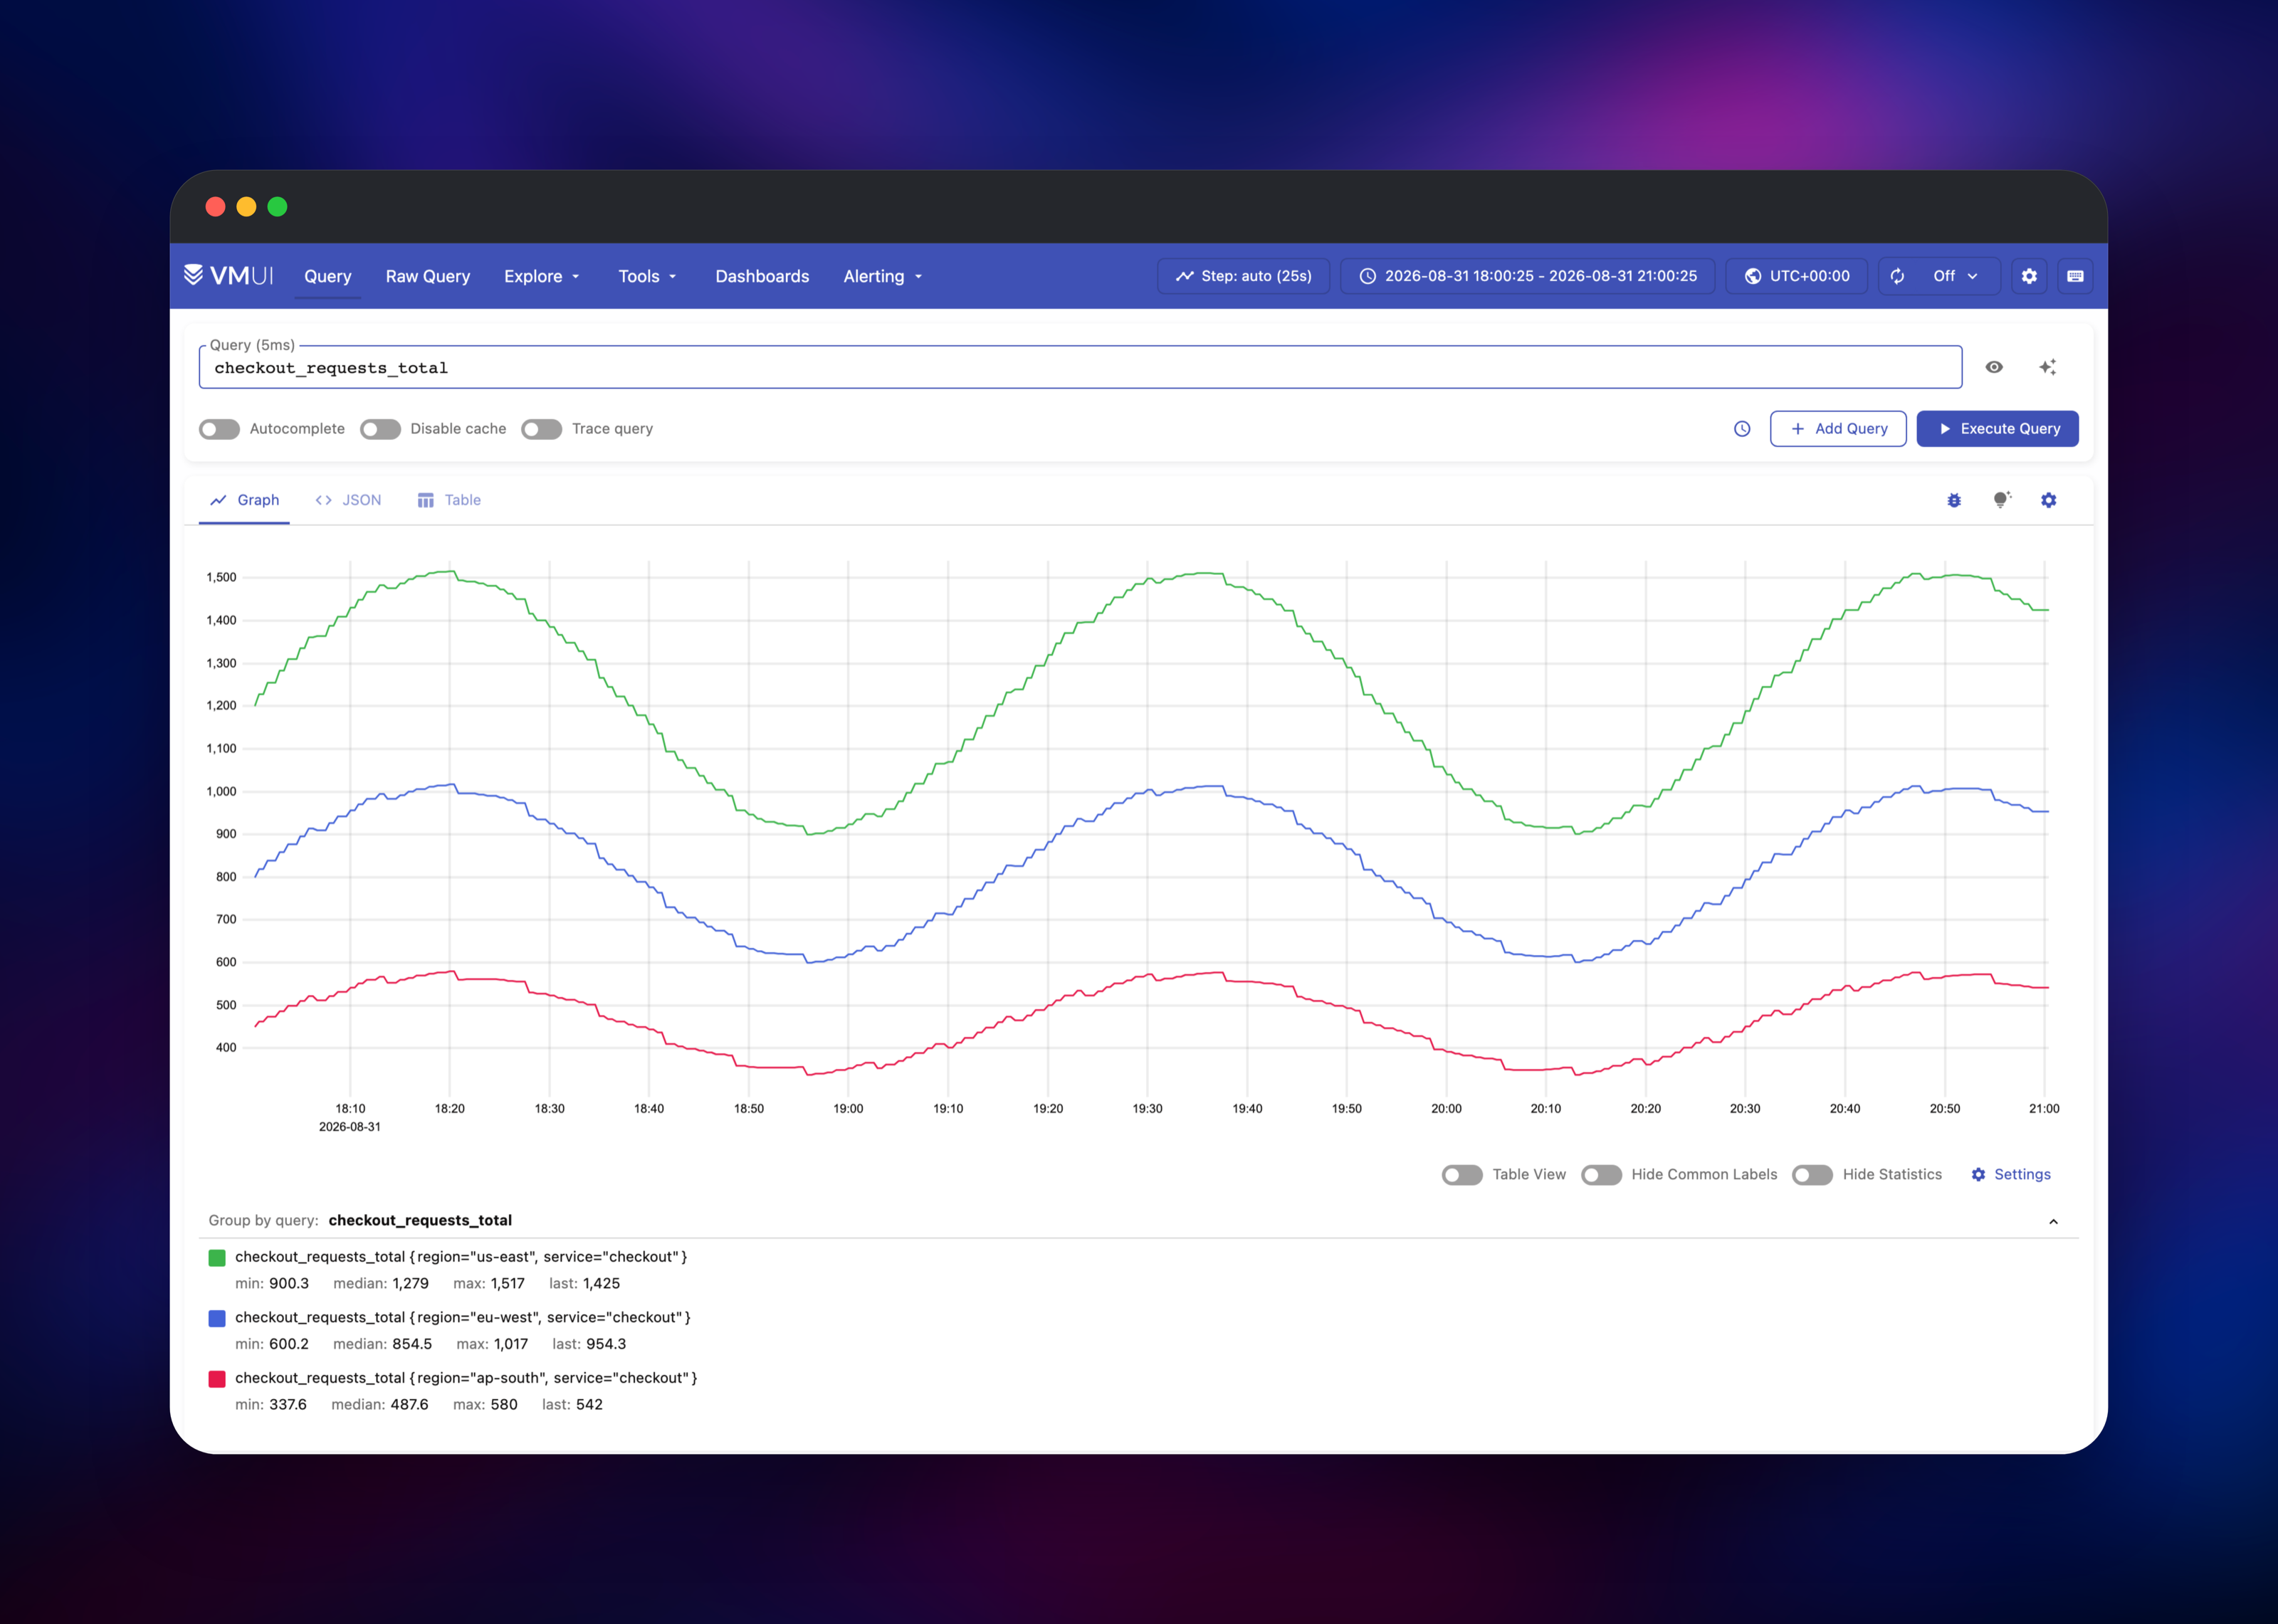
Set a username and password at deploy time — the only credentials in the stack, guarding every route on the public domain. Open the public URL and you land in VMUI, the built-in query interface, scoped to tenant 0. Type up and press Execute: seven series come back, one per service, because the bundled scraper already monitors the cluster itself. That query alone confirms writes, storage and reads all work.
Point your own metrics at it next. Prometheus, vmagent, an OpenTelemetry collector or Grafana Alloy can remote-write to https:///insert/0/prometheus/api/v1/write with basic auth. In Prometheus:
remote_write:
  - url: https://your-app.up.railway.app/insert/0/prometheus/api/v1/write
    basic_auth:
      username: admin
      password: your-password
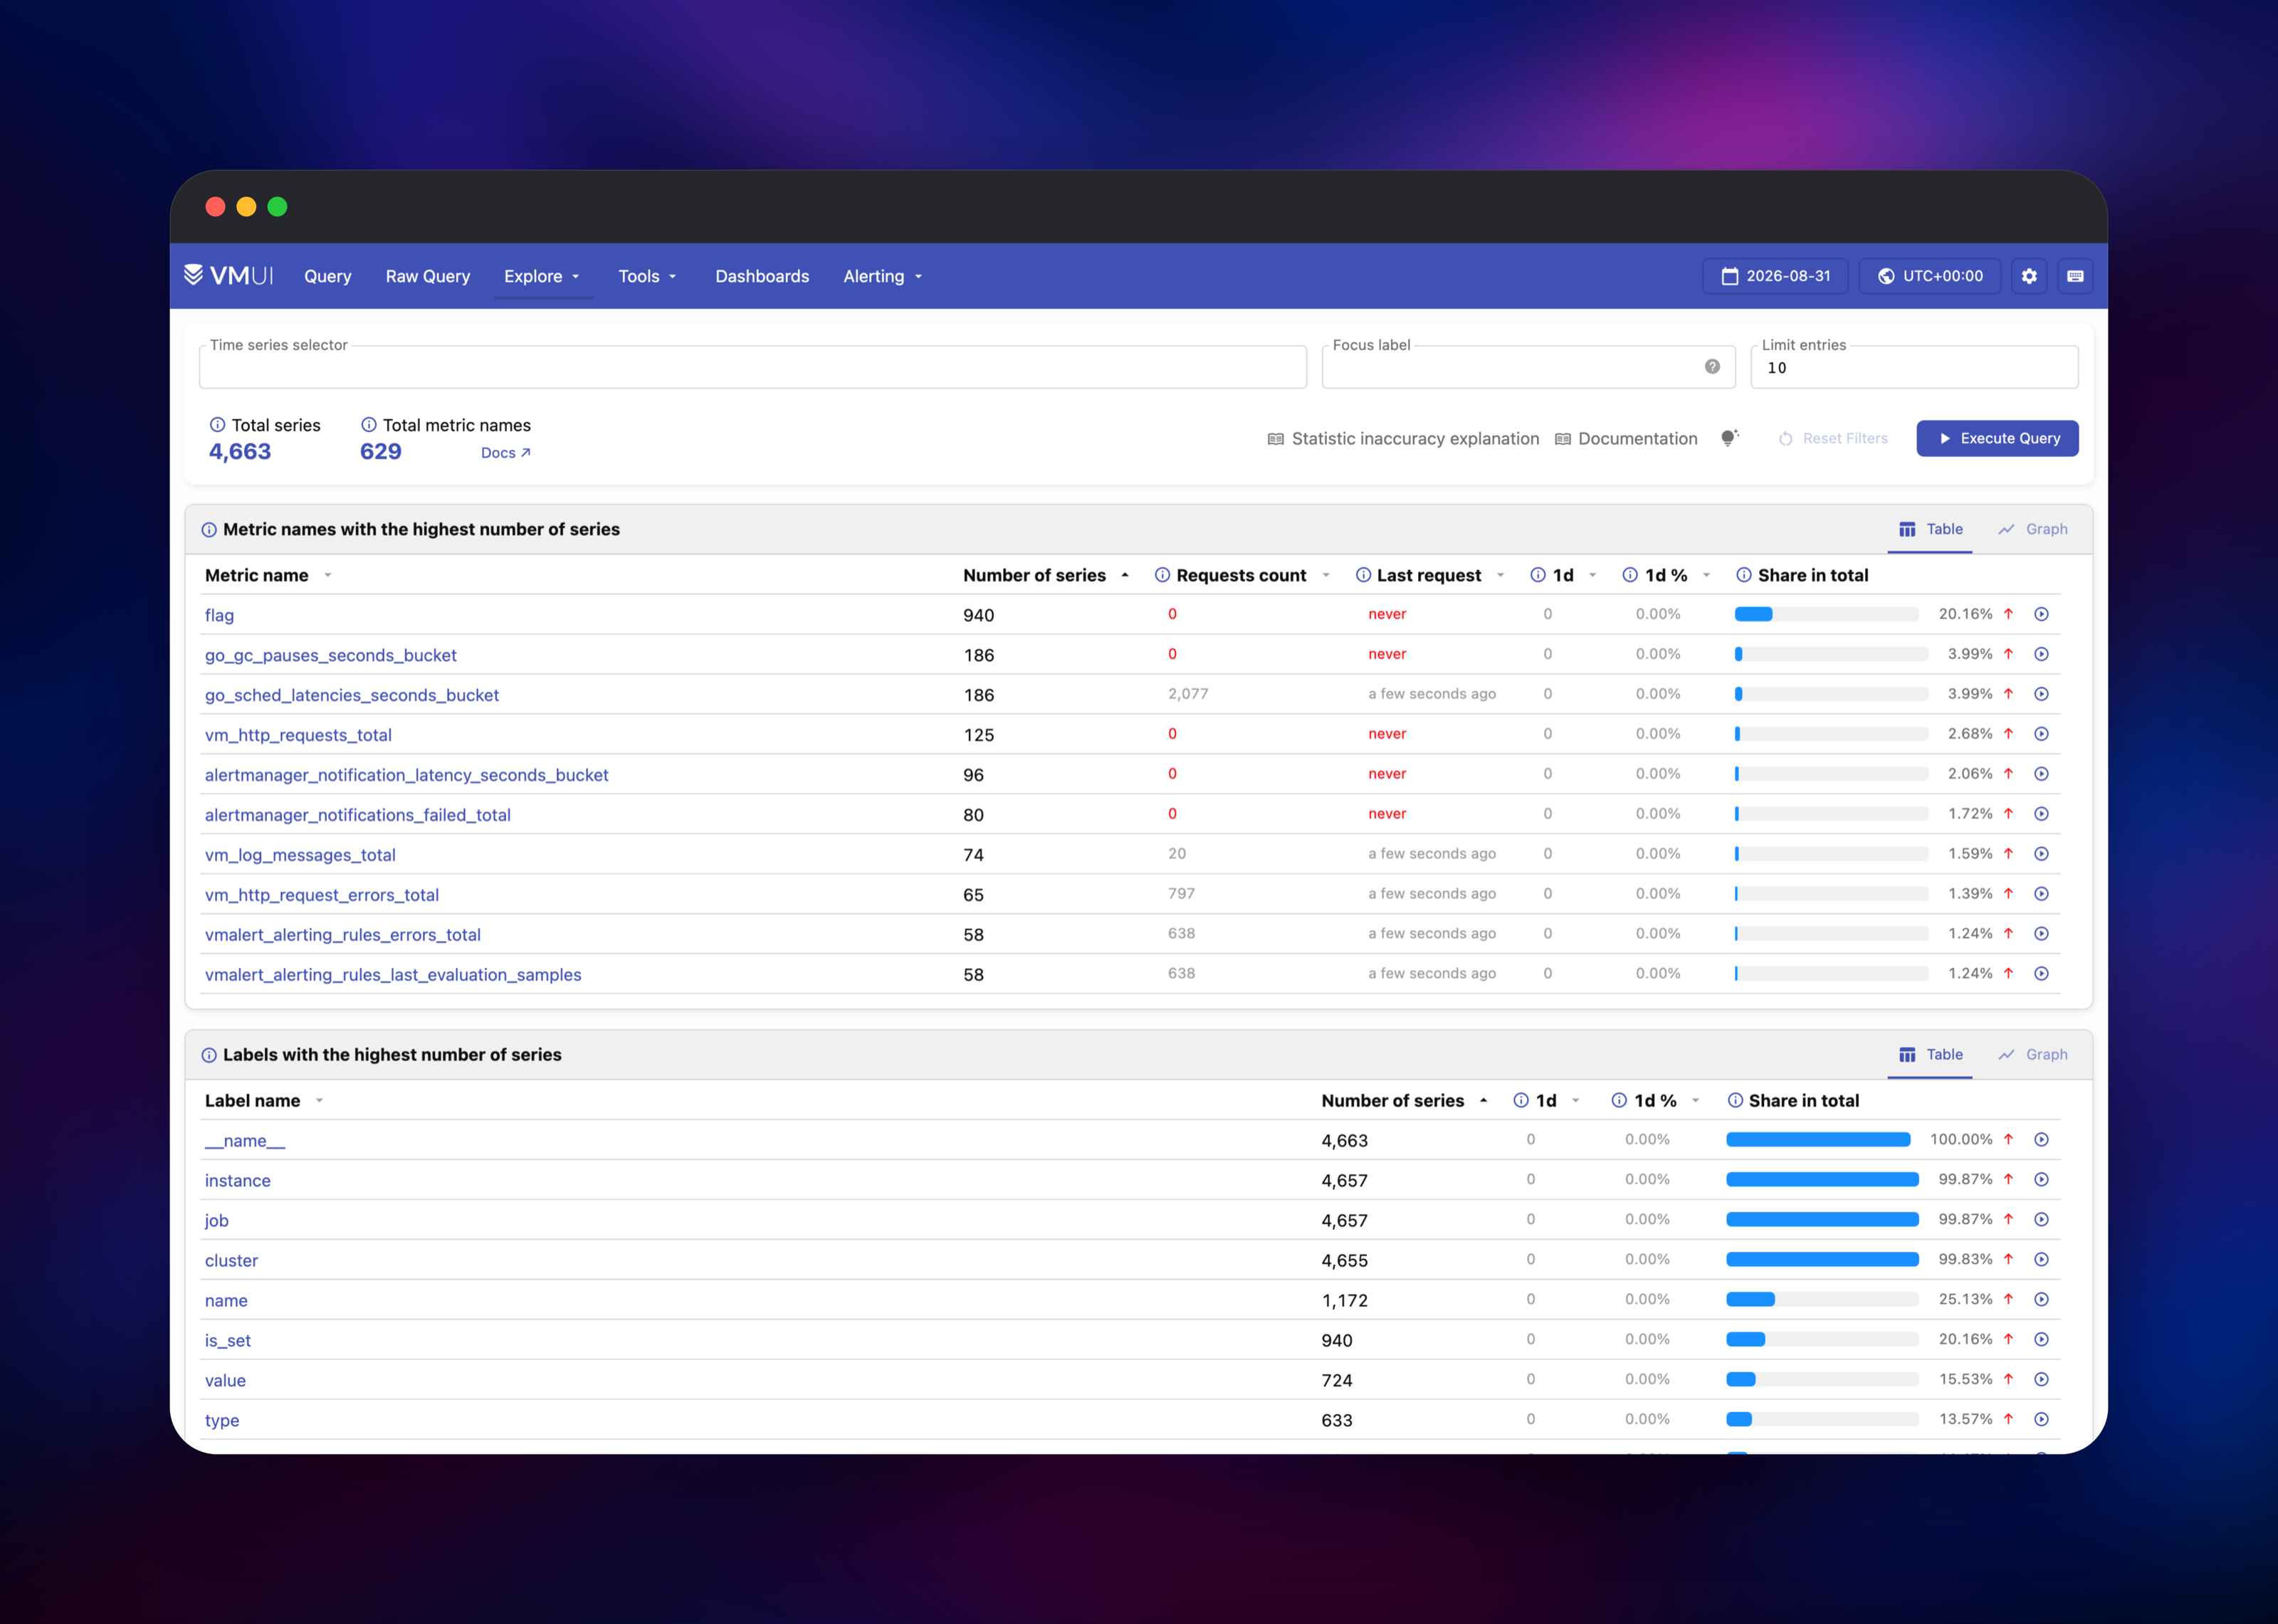
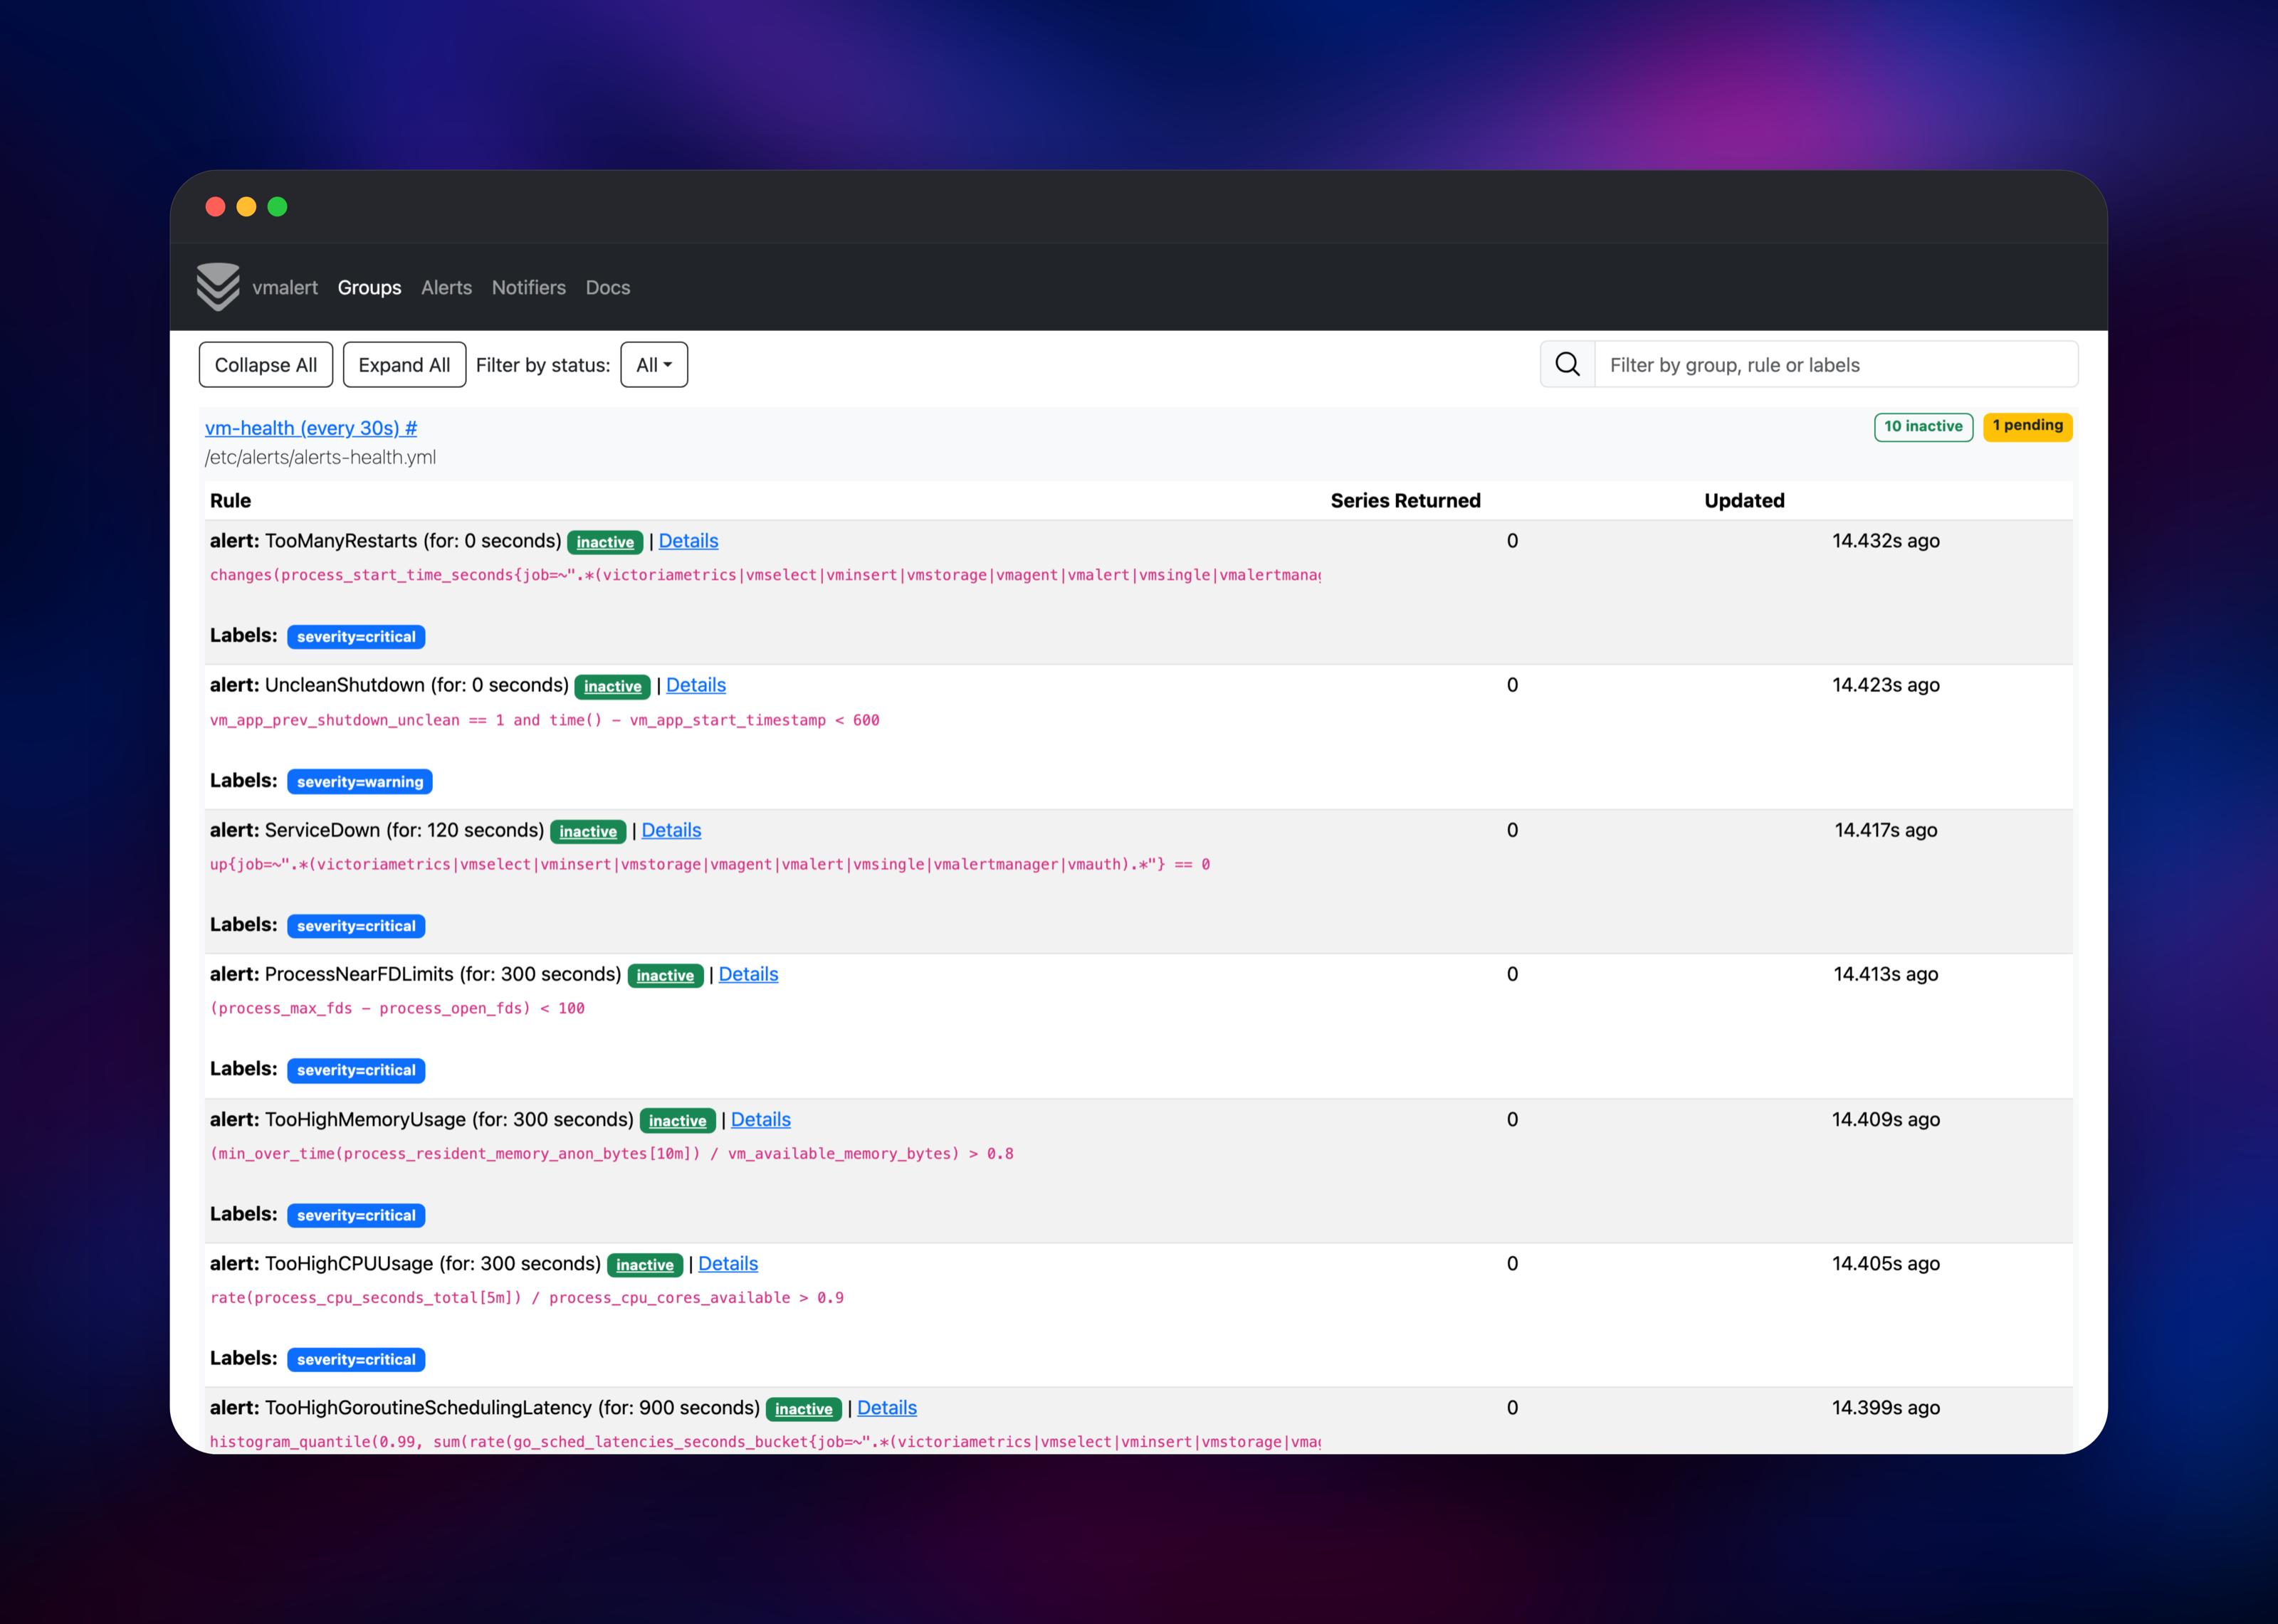
For Grafana, add a Prometheus datasource pointing at https:// with basic auth — the gateway maps /api/v1/* onto tenant 0, so the bare domain is a working datasource URL. VMUI's Explore menu opens the cardinality explorer, and the Alerting menu opens the rule browser.
About Hosting VictoriaMetrics
VictoriaMetrics solves the problem every growing Prometheus deployment hits: retention. Prometheus is built for short local retention and no clustering, so long history usually means bolting on Thanos or Cortex. VictoriaMetrics is one project covering ingestion, storage, querying and alerting.
- MetricsQL — a PromQL superset, so existing dashboards keep working
- Wide ingestion support — Prometheus remote write, InfluxDB line protocol, Graphite, OpenTSDB, DataDog, CSV and JSON import on one endpoint
- Aggressive compression — far less disk per sample than Prometheus' TSDB, which is what makes long retention affordable
- Multi-tenancy — an account ID in the URL path separates teams
- Cardinality tooling — an explorer for the labels quietly inflating your series count
Writers reach only vminsert, readers only vmselect. Because those tiers are separate Railway services, a query storm cannot slow ingestion.
Why Deploy VictoriaMetrics on Railway
Railway runs the full cluster shape with no orchestration work.
- Seven services deploy in one click, wired together
- Persistent volumes for metrics, the scrape queue and alert state
- Private networking keeps every tier but the gateway off the internet
- A public HTTPS domain with authentication in front
- Scale ingestion, query or storage independently
Common Use Cases
- Long-term Prometheus storage — remote-write existing servers here and keep months of history without Thanos
- Central metrics for many services — one endpoint, tenant IDs separating teams
- Grafana backend — point dashboards at the gateway, in PromQL or MetricsQL
- Infrastructure monitoring — pair with node_exporter, cAdvisor or OpenTelemetry and alert on it
Dependencies for VictoriaMetrics
Every service runs an official image, all on the same version:
victoriametrics/vmstorage:v1.151.0-cluster— samples and index on a volumevictoriametrics/vminsert:v1.151.0-cluster— accepts writes, shards them across storagevictoriametrics/vmselect:v1.151.0-cluster— executes queries, serves VMUIvictoriametrics/vmauth:v1.151.0— authenticating gateway, the only public servicevictoriametrics/vmagent:v1.151.0— scrapes the cluster, writes it backvictoriametrics/vmalert:v1.151.0— evaluates alerting and recording rulesprom/alertmanager:v0.28.1— groups firing alerts and delivers notifications
Components must run the same VictoriaMetrics version — move every tag together when you upgrade.
Environment Variables Reference
| Variable | Service | Purpose |
|---|---|---|
VM_USERNAME | vmauth | Username for the public gateway |
VM_PASSWORD | vmauth | Password for the public gateway |
VM_RETENTION_PERIOD | vmstorage | How long samples are kept (1 = a month) |
ALERT_WEBHOOK_URL | alertmanager | Optional webhook for alert delivery |
VMALERT_EVALUATION_INTERVAL | vmalert | How often rules are evaluated |
VM_INTERNAL_AUTH_KEY | vmauth | Optional key guarding the gateway's metrics endpoints |
Host variables such as VMSTORAGE_HOST are pre-wired to Railway's private domains and need no attention.
Deployment Dependencies
- Source: github.com/VictoriaMetrics/VictoriaMetrics
- Docs: docs.victoriametrics.com
- Images: hub.docker.com/u/victoriametrics
- Alertmanager: github.com/prometheus/alertmanager
Hardware Requirements for Self-Hosting VictoriaMetrics
| Resource | Minimum | Recommended |
|---|---|---|
| CPU | 2 vCPU total | 4+ vCPU, weighted to vmselect and vmstorage |
| RAM | 2 GB total | 8 GB+, most of it on vmstorage |
| Storage | 5 GB volume | Sized from series count, retention |
| Runtime | Linux container | Same for all components |
Memory on vmstorage scales with active series, not sample volume — cardinality is the number to watch.
Self-Hosting VictoriaMetrics
The single-node build is one binary, and the right starting point elsewhere:
docker run -d --name victoriametrics \
  -p 8428:8428 \
  -v vmdata:/victoria-metrics-data \
  victoriametrics/victoria-metrics:v1.151.0 \
  -storageDataPath=/victoria-metrics-data -retentionPeriod=12
The cluster version splits that into three processes; storage listens on two internal ports:
vmstorage -storageDataPath=/storage -vminsertAddr=:8400 -vmselectAddr=:8401
vminsert  -storageNode=vmstorage:8400
vmselect  -storageNode=vmstorage:8401
Every component listens and dials on IPv4 only unless started with -enableTCP6, which this template sets.
Is VictoriaMetrics Free?
VictoriaMetrics is open source under the Apache 2.0 licence, cluster version included, with no seat, series or retention limit. The company sells an enterprise edition adding downsampling and backup automation, plus a managed cloud, but nothing here depends on either. On Railway you pay only for the compute and volumes the services use.
VictoriaMetrics vs Prometheus and Thanos
| VictoriaMetrics | Prometheus | Thanos | |
|---|---|---|---|
| Long-term storage | Built in | Local, short | Object storage |
| Clustering | Native, role-based | None | Layered on Prometheus |
| Query language | MetricsQL | PromQL | PromQL |
| Moving parts | One project | One binary | Several components |
Prometheus stays excellent at scraping and short-term storage; VictoriaMetrics is what goes behind it when history and scale matter. Against Thanos, fewer moving parts for the same outcome.
FAQ
What is VictoriaMetrics? An open-source, Prometheus-compatible time-series database and monitoring stack built for high ingestion rates, low disk usage and long retention.
What does this Railway template deploy? A seven-service VictoriaMetrics cluster: storage, insert and select tiers, an authenticating gateway on the public domain, a scraper, a rule evaluator and Alertmanager.
Why does the template include volumes and an alerting service? The storage tier writes metrics to disk and needs a volume that survives redeploys; the scrape queue and alert silences need their own. The alerting services turn stored metrics into notifications rather than dashboards someone has to watch.
How do I send metrics to self-hosted VictoriaMetrics?
Remote-write from Prometheus, vmagent, an OpenTelemetry collector or Grafana Alloy to /insert/0/prometheus/api/v1/write on your public domain, with the username and password you set at deploy time.
How do I scale VictoriaMetrics on Railway?
Add another storage service and list both in the -storageNode flags on insert and select, or raise replicas on insert and select, which keep no local state.
Template Content
alertmanager
gridalpha/victoriametrics-railway