Deploy Netdata [Updated May ’26]
Netdata [May ’26] (Application Monitoring alternative to Datadog) Self Host
netdata-railway
Just deployed
/netdata-storage

Deploy and Host Managed Netdata Service with one click on Railway
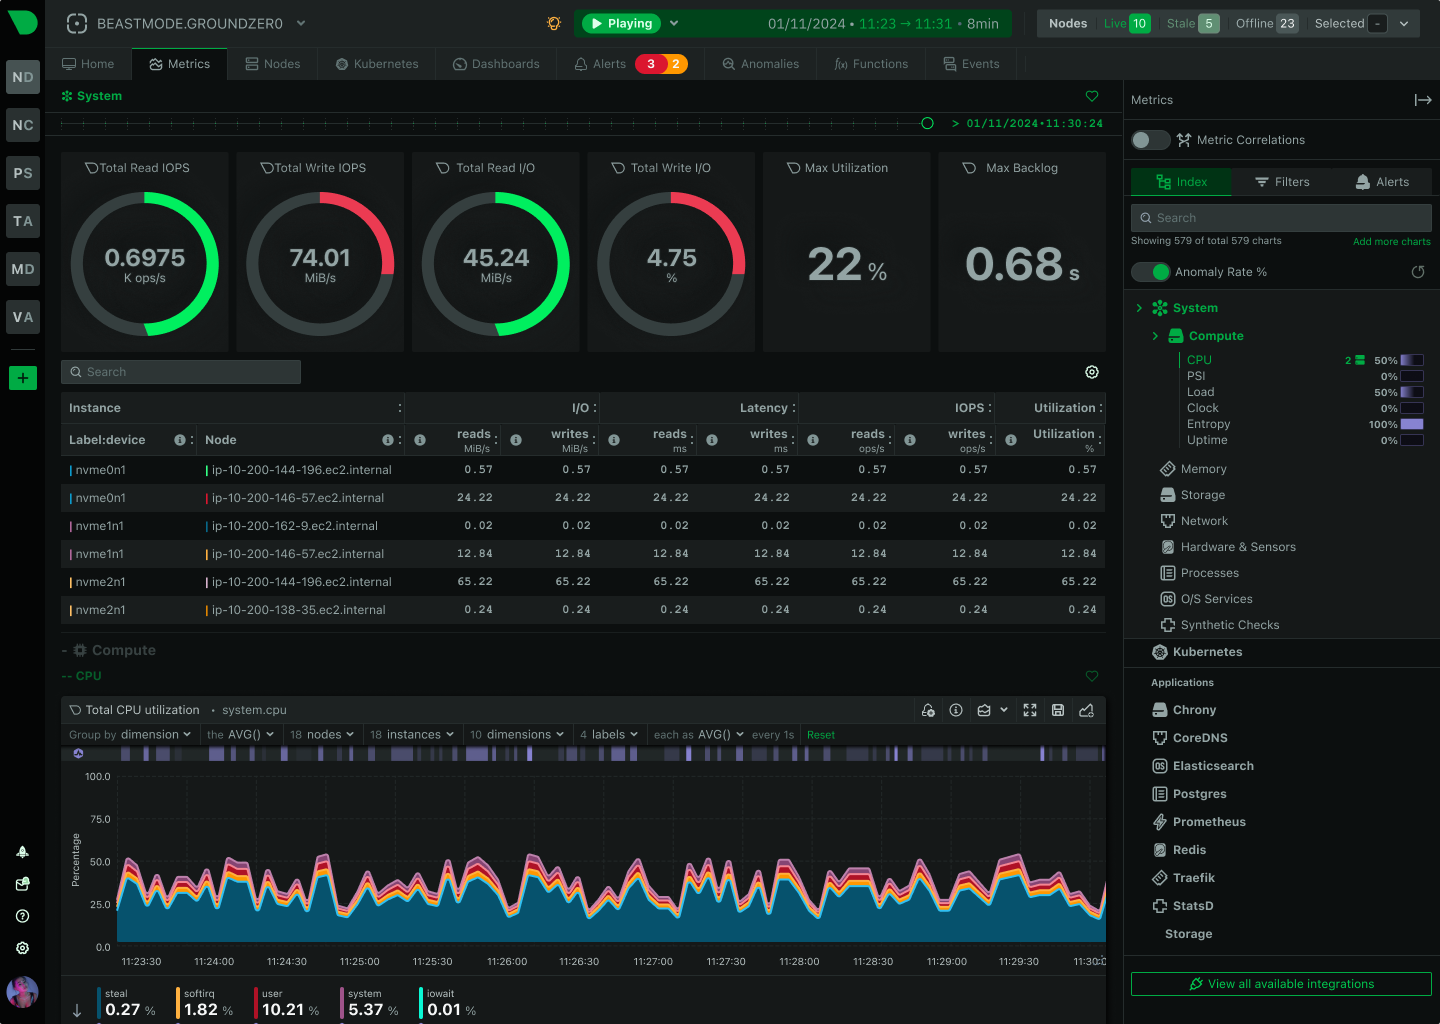
Netdata is a free, open-source, real-time monitoring and troubleshooting tool available on Netdata GitHub. It provides in-depth insights into servers, containers, applications, and networks, helping engineers, developers, and businesses detect issues quickly and maintain system health. Netdata is widely known for its modern, interactive dashboard, lightweight footprint, and ability to analyze thousands of metrics per second without slowing down your infrastructure.
About Hosting Netdata on Railway (Self Hosting Netdata on Railway)
You can self-host Netdata to monitor your servers, apps, and cloud environments in real time. By hosting it on Railway, you get complete control over your monitoring data with zero third-party interference. Netdata’s dashboards are intuitive and packed with detailed visualizations, letting you troubleshoot performance bottlenecks, security issues, and system failures within seconds. Hosting on Railway makes the deployment process seamless, with automated scaling, minimal configuration, and built-in security.
Why Deploy Managed Netdata Service on Railway
Deploying a managed Netdata service on Railway gives you:
- Effortless Setup – One-click deployment without manual server setup.
- Automated Scaling – Railway automatically adjusts resources based on traffic.
- Simplified Maintenance – Railway manages updates, backups, and security patches.
- Privacy and Control – Keep monitoring data under your ownership while enjoying a managed experience.
Railway vs DigitalOcean:
DigitalOcean requires manual VM setup, patching, and monitoring integration. Railway allows you to deploy Netdata Docker containers instantly, with everything handled in the background.
Railway vs Linode:
Linode users need to configure system metrics collectors manually. On Railway, Netdata comes ready to run in managed containers with dashboards instantly accessible.
Railway vs Vultr:
Vultr demands manual configuration for monitoring and alerts. Railway automates this and provides a Netdata dashboard out of the box.
Railway vs AWS Lightsail:
AWS Lightsail can be complex, with networking and scaling requiring sysadmin skills. Railway reduces this to a one-click setup and auto-scaling deployment.
Railway vs Hetzner:
Hetzner offers raw power but expects you to manage every detail. Railway takes care of scaling, updates, and hosting while giving you a Netdata free monitoring service at low cost.
Common Use Cases
Here are 5 common use cases for Netdata:
- Server Monitoring – Monitor CPU, memory, I/O, and disk usage in real-time with zero overhead.
- Container Monitoring – Gain visibility into Docker and Kubernetes clusters, tracking resource usage per container.
- Application Performance Monitoring – Detect bottlenecks in apps by monitoring databases, caches, and APIs.
- Cybersecurity Monitoring – Use Netdata to detect abnormal traffic, port scanning, and system intrusions (Netdata cybersecurity).
- Multi-cloud Infrastructure Visibility – Centralize monitoring across AWS, GCP, Azure, and Railway deployments.
Dependencies for Netdata hosted on Railway
To host Netdata, you need a working Docker container or binary installation. Railway makes this simple by packaging Netdata in containers that run instantly.
Deployment Dependencies for Managed Netdata Service
- Netdata Docker image (official image from Netdata GitHub)
- Required ports (default: Netdata port 19999)
- Minimal Railway configuration (no manual system setup needed)
Implementation Details for Netdata Dashboard
On Railway, you only need to:
- Deploy the Netdata Docker template.
- Configure environment variables if needed.
- Expose the Netdata dashboard to access your system metrics securely.
How does Netdata compare with other monitoring tools (Alternatives)
Netdata vs Prometheus
Prometheus is a time-series database for long-term monitoring but requires Grafana for visualization. Netdata provides real-time monitoring with built-in dashboards.
Netdata vs Grafana
Grafana is a visualization tool that needs data sources like Prometheus. Netdata integrates collection and visualization in a single tool, making it simpler for small teams.
Netdata vs Datadog
Datadog is SaaS-based and expensive for startups. Netdata is open-source, free, and self-hosted with instant Railway deploy options, though Datadog offers more enterprise integrations.
Netdata vs Zabbix
Zabbix requires heavy configuration and setup, whereas Netdata offers auto-detection and instant dashboards with minimal configuration.
Netdata vs Nagios
Nagios focuses on alerts and uptime checks, while Netdata provides detailed, real-time, interactive dashboards with troubleshooting metrics.
Netdata vs Elastic Stack (ELK)
Elastic Stack (Elasticsearch, Logstash, Kibana) is powerful for log management and analytics but requires significant setup and resources. Netdata is lighter, real-time focused, and easier to deploy.
Netdata vs New Relic
New Relic is a commercial APM with deep integrations, but it comes with a steep cost. Netdata provides a Netdata free solution with real-time metrics suitable for most use cases.
Netdata vs InfluxDB + Telegraf + Chronograf (TICK Stack)
The TICK stack provides time-series metrics and dashboards but needs integration and tuning. Netdata simplifies the experience by bundling monitoring, storage, and dashboards together.
Netdata vs Observium
Observium is great for network monitoring but limited in application insights. Netdata gives you a complete picture across servers, apps, containers, and networks.
Netdata vs Checkmk
Checkmk offers enterprise-grade monitoring but has a learning curve. Netdata provides instant visualizations with almost no setup.

How to use Netdata?
To use Netdata:
- Deploy Netdata on Railway using the one-click button.
- Access your Netdata dashboard through the public Railway URL.
- Connect servers, apps, or containers to the dashboard.
- Start monitoring real-time metrics instantly.
How to self host Netdata on other VPS?
Clone the Repository
Clone from GitHub: git clone https://github.com/netdata/netdata
Install Dependencies
Run the Netdata installer: bash <(curl -Ss https://my-netdata.io/kickstart.sh)
Configure Environment
Ensure required ports are open (default: 19999). Optionally configure authentication.
Start Netdata Service
Run the Docker container: docker run -d -p 19999:19999 netdata/netdata
Access Dashboard
Visit http://your-server-ip:19999 to view your metrics.
On Railway, you can skip most of these steps. Just click Deploy Now.
Features of Netdata
- Real-time, per-second metrics for systems and apps.
- Interactive, web-based Netdata dashboard with charts and graphs.
- Auto-detection of 100s of services and system metrics.
- Lightweight footprint (<1% CPU, minimal RAM usage).
- Free and open-source with enterprise support via Netdata corp.
- Secure by default with role-based access.
- Easy install via Netdata installer or Docker.
Official Pricing of Netdata Cloud
Netdata Cloud is free for individuals and small setups. Enterprise features include advanced user management, SSO, and priority support from Netdata corp. Paid enterprise plans vary depending on infrastructure scale. [Updated Oct ’25]
Self hosting Netdata vs Netdata Cloud
- Self hosting Netdata: 100% free, full control, data stays on your server.
- Netdata Cloud: Adds centralized dashboards across nodes, managed features, and enterprise support.
Monthly Cost of Self Hosting Netdata on Railway
Self-hosting Netdata on Railway generally costs $5–$10 USD per month for the base service. Costs may increase depending on traffic and storage.
System Requirements for Hosting Netdata
- CPU: 1 core
- RAM: 512 MB+
- Disk: Minimal storage (lightweight install)
- Ports: 19999 (default)
FAQs
What is Netdata?
Netdata is an open-source, real-time monitoring and troubleshooting tool available on Netdata GitHub.
How do I self host Netdata?
You can self-host Netdata using Docker or the official installer. On Railway, just click Deploy Now.
What are the key features of Netdata?
Netdata offers real-time dashboards, lightweight monitoring, auto-detection of metrics, and Netdata free deployment options.
How do I deploy Netdata on Railway?
Use the one-click deployment template. Railway automatically handles scaling and updates.
What is Netdata Cloud?
Netdata Cloud is a hosted solution by Netdata corp that centralizes monitoring across multiple nodes with enterprise features.
What are common use cases for Netdata?
System monitoring, container visibility, app performance monitoring, cybersecurity insights, and multi-cloud monitoring.
How does Netdata compare to other tools?
Unlike Prometheus, Nagios, or Zabbix, Netdata provides instant dashboards, lightweight install, and real-time monitoring with zero extra setup.
How much does it cost to self host Netdata on Railway?
$5–$10/month on average, depending on resources.
Where can I find the Netdata source code?
You can access the source code on the official Netdata GitHub repository.
With Netdata on Railway, you get real-time system monitoring with just one click. Deploy Now and start troubleshooting smarter today!
Template Content
netdata-railway
Shinyduo/netdata-railway